AMR has traded off it’s high of 9.24. Oil has rebounded, inflation and commodity speculators are supporting prices for the time being. The Federal Reserve reports no heightened risks of inflation in the near future however. It may be good to form an opinion of the long term trend, but it may also be more important to make money than be right. Depending on what you are interested in.
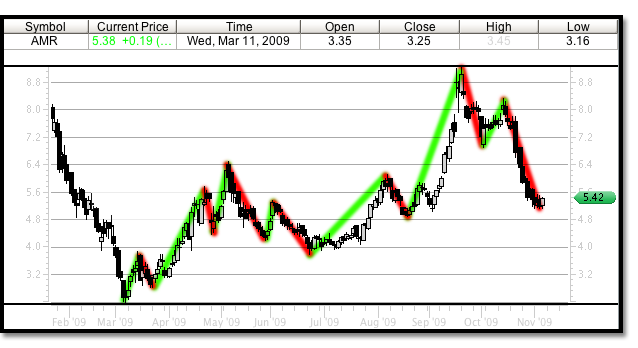
AMR technical chart is acting quite responsibly in its most recent pullback. It appears to be nearing the completion of a simple ABC correction, or zig zag correction, in which case AMR should be bought for a move higher. Look at the chart below for a review of what has been happening.
The green lines obviously are the uptrends and the red the downtrends. From the March low of 2.40 there have been two simple corrections, including the one in question. The math is easy, and in this months correction is spot on and worth analyzing for example of how to set up a likely trade in AMR. Furthermore, there are many more correlations between the two corrections on a larger scale that one can delve into. For example, what does 6.50 – 2.40 x 2.236 equal?
Anyhow, here is what seems to be occurring in both instances. A simple correction has three waves, ABC. The A wave is always 38%, the B wave is always 62% of the magnitude of the A wave and the C wave is always 62%.
In the current correction, from 9.24 to 6.90 is the initial 38% A wave. The A wave has a magnitude of 2.34. 62% of this is 1.4508. Add this to 6.90 and you get 8.3508. The top of the B wave was 8.33. Now look for the C wave to be a flat correction and retrace again to the 38% level or break to the 62% level to reveal a zig zag correction.
Right now, AMR has traded to 5.11. It’s traded to this low on November 2 and held again on the 5th. This could represent a double bottom. Currently it is not certain if the correction is complete. If this 5.11 trading level is tested again it will likely not hold.
The exact 62% correction would be 4.99. Look for a further correction between this level, 4.99 and the 4.31 – 3.79 trading range. A break of 3.79 would be very bearish for AMR.
If AMR reverses from this current correction it could trade to 12.18 and 17.23.
December 10, 2009:
AMR has traded positively since the trading analysis on 11/05/2009. Today we can update the move and determine possible new opportunities to come. The larger trend for AMR still remains positive at this point.
View the daily time frame chart below to follow the recent trading in AMR. AMR traded from the 5.11 low to a high of 6.14 to create a potential wave 1. This wave was tested and validated with the correction to wave 2 low of 5.40. A 62% Fibonacci retracement was 5.49. The most recent move higher off this low traded to a top of 7.40. The wave 3 target profit level was 7.41. AMR has since corrected this move trading to a low of 6.83, the beginning of a corrective wave 4. 62% of this move added to the low, or A wave of the correction would be 7.18. December 10, 2009 AMR trading high was 7.18.
The next trading turning point for AMR may be at a 46% retracement of the move off 5.11. Because the wave 2 correction was 62%, there is often an alternation of magnitude in the wave 4 correction. Currently AMR has made approximately a 38% correction from 7.40, although the exact level would be 6.52. Another possible tip to the turning point could be the gap at 6.34, which is the 46% retracement level exactly. Once this correction has completed AMR will trade to 8.83 before a correction or larger trend continues.


