DryShips Inc. is up 22% in the past two trading days. DRYS has been volatile in the past and traders are looking for more of that to finally continue. 83% off its low in March of 08′ DRYS is still 130% below its high of 11.48 made in May after the market rebound.
We wont revisit longer term predictions and analysis, but instead lets see if DRYS can complete some bullish wave sequences near term. It certainly has so far as the diagrams below will show, but it has not completed a parent wave since 11.48 high, and even if that was a bullish parent wave, it would have been a rare irregular wave 2.
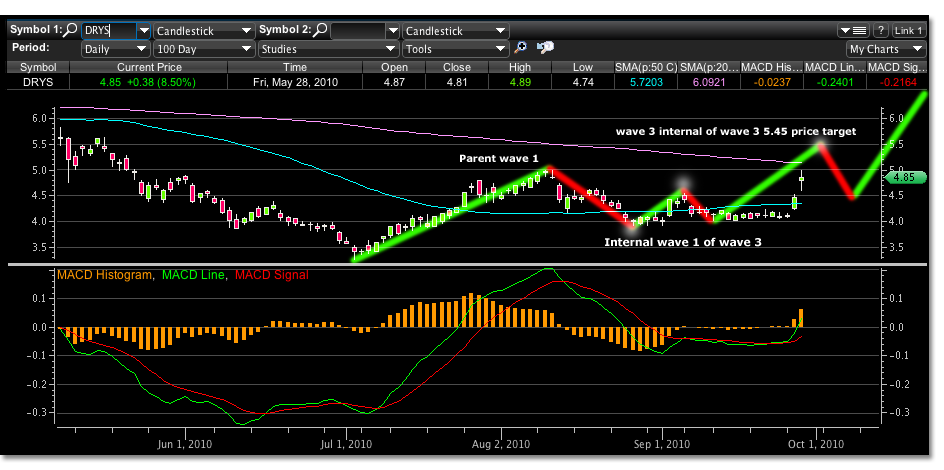
Lets start the current technical analysis by looking at the daily chart at 100 day interval and project that the 3.28 low to the 4.99 high on August 9, 2010 is a completed wave 1 of this time frame.

If the following 3.92 trading low is used as the price zero point of an internal wave 1 of wave 3, then the magnitude of this internal wave could be drawn to the 4.11 high. This wave 1 magnitude would project a wave 5 of wave 1 price target of 4.60. The trading high on September 3, 2010 was 4.55.
Notice that an anticipated correction of 4.02 was expected from the 4.99 parent high. This price projection was used almost exactly for the price zero point of the internal wave just described.
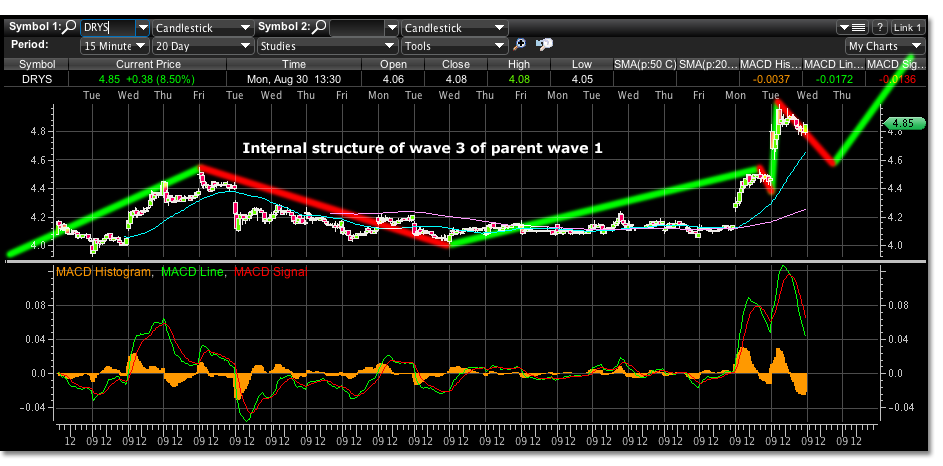
From the internal wave 5 price target of 4.60 a correction of 4.18 is expected. Trading consolidates between 4.02 and 4.24 for 11 trading days. Then the last two trading days have been large moves to the upside. Our first anticipated price target using the initial wave 1 magnitude of 3.92 to 4.11 is 4.53. This would be internal wave 1 price high of wave 3. This price target was hit exactly as the price high on September 27, 2010. The next bullish price target would be wave 3 of wave 3 at 4.97. Todays price high was 4.99 on September 28, 2010.

The correction waves during this volatile move may be less than anticipated, but initially have not been too far off as wave 2 correction was anticipated to be 4.31, a low of 4.42 was reached. And for the wave 4 correction likely to come in the morning, prices could reach towards 4.65 to 4.48. The last price target of this internal waves magnitude would be wave 5 of wave 3. The price target is 5.45.
A correction will then subsequently occur from this level but ultimately what a bull would like to see is a parent wave 5 completed. The internal wave being outlined would result in a price target around 6.40. The parent wave of this structure is set to hit a price target for its internal wave 3 at 7.10. So this range could be used to take profits. If a wave 5 does not develop, building a position within an expected wave 4 correction can be very costly mistake.
Trade price motion as it happens. These predictions should be verified and nullified in real time to reduce your risk and build upon your trading strategy.
