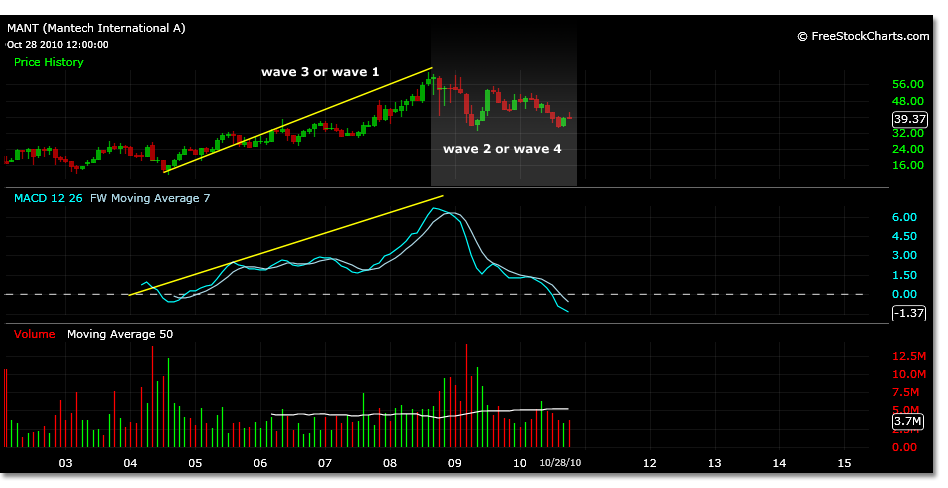
On the monthly chart there is ambiguity to price motion due to the lack of price history since the IPO. It is important to always start with the largest time frame to identify the most powerful trend in play, even if shorter trends may be contrary to the analysis. The largest wave of a 5 wave sequence represented by the MACD is a wave 3. However, there is only one wave peak in the monthly chart. Is this a wave 3 or a wave 1? The scenario varies for each correction wave. The wave 2 and wave 4 structures are not entirely clear although there is evidence within the price motion to follow and base a trading strategy from. Always trade in the present, not the future. As the present price motion develops so will the future expectations.
There is room to complete three scenarios:
1. On a much smaller time frame, currently MANT is trading from 34.69 to 42.20, a complete 5 wave Elliott Wave sequence. Is MANT in the beginning stages of wave 1 internal of parent wave 3?
2. Focusing on the larger time frames being incomplete, is an elongated parent wave 2 sequence forming in which the B wave has formed a triangle and the C wave has not yet occurred?
3. Also larger time frame, is the monthly chart despite its lacking price history showing an internal wave 3 of a larger parent wave 1 and the current correction is a parent wave 4 triangle?
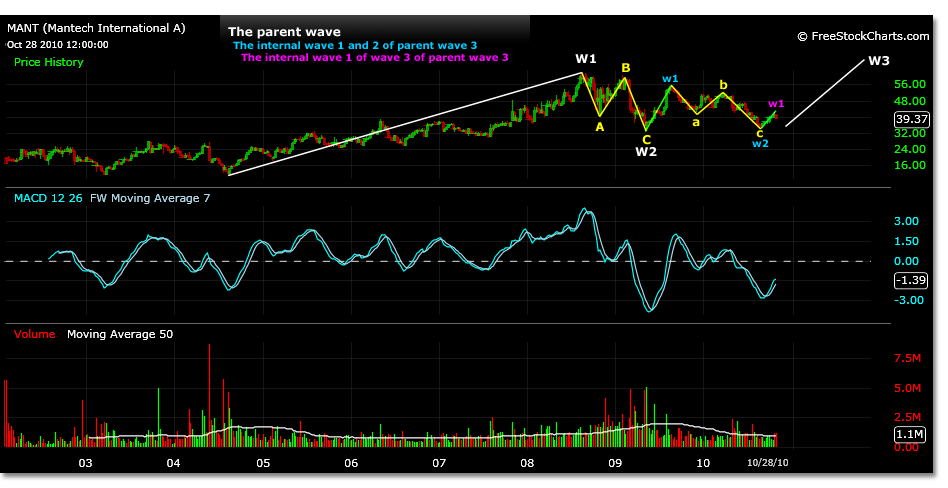
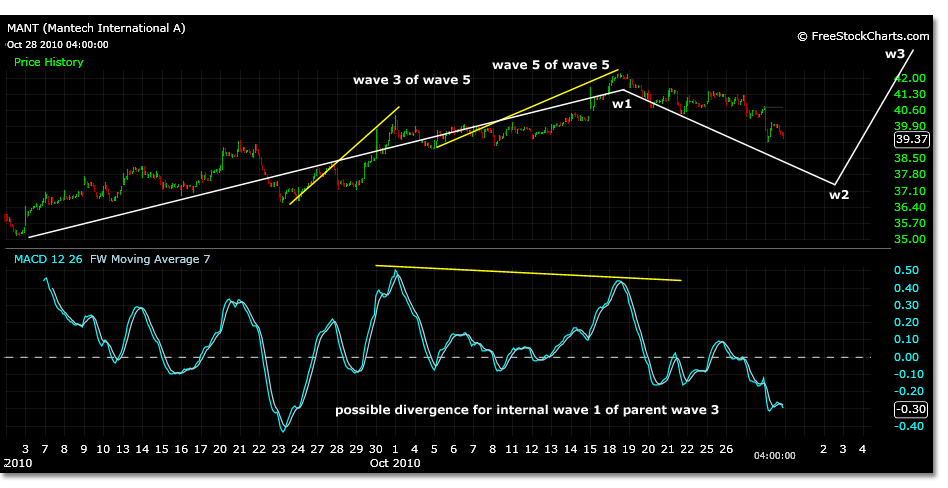
If the chart is showing us scenario 1, in which we have completed the parent ABC correction and are in the beginning stages of wave 1 of parent wave 3, reference the chart below to the present.
This first weekly chart follows a completed ABC correction almost to the decimal using its parent wave 1 magnitude. Look for the following price motion projections to possibly play out. Consider the price motion from the latest move off the 34.69 low of August 27, 2010 to 42.20 as MANT now corrects. Yesterday, October 28 2010, the correction appeared to be a flat correction, the 39.18 price low would correlate closely to a 38% correction. At todays open MANT has traded to a low of 38.87 so far. Look for a simple correction to possibly extend to 37.55, a 68% retracement level.
Because this scenario is a projection of a correction of the internal wave 1, it is possible to correct up to 100% of a wave 1 magnitude and still be a valid wave sequence. 46.16 and 51.48 are possible near term price targets of this initial internal wave structure if the 34.69 low holds and higher highs within the parent wave 3 would then develop.
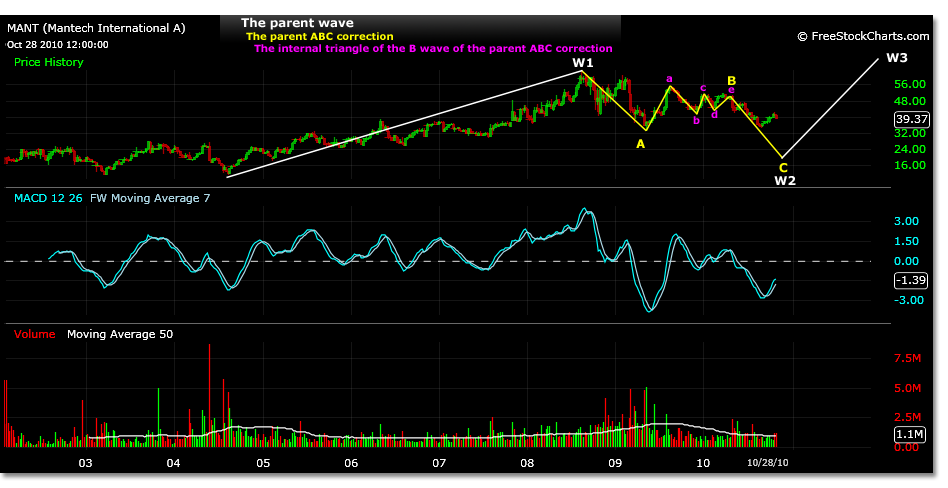
If the chart is showing us scenario 2, in which we have only just completed an internal B wave triangle and are in the beginning stages of a wave C correction lower, reference the chart below to the present.
A break of 32.86 could lead to a minor break in price to 30.53, the initial wave C target. Or, a break of 32.86 could result in trading sharply lower to between 25.15 and 16.43. These price points represent the initial internal wave 1 high and wave 2 low of the parent wave. Often these can be targets of extreme wave 1 corrections beyond the Fibonacci ABC retracement levels.
A pullback of this magnitude would signal that the consolidating pattern MANT has been within from the 62.06 price high to May 2009 was the completion of a A wave possibly of the monthly time frame. Following this was a B wave triangle which could have ended on April 30, 2010 as shown by the sharp move lower of 9% on this date.
This could have been the beginning of the C wave of a larger ABC wave 2 correction of the parent wave 1. The internal B wave triangle completes itself near a 38% retracement of the prior parent waves magnitude relative to time frame which corresponds to this date in the price chart fairly accurately. Any wave 2 correction can span 100% of the wave 1 magnitude.
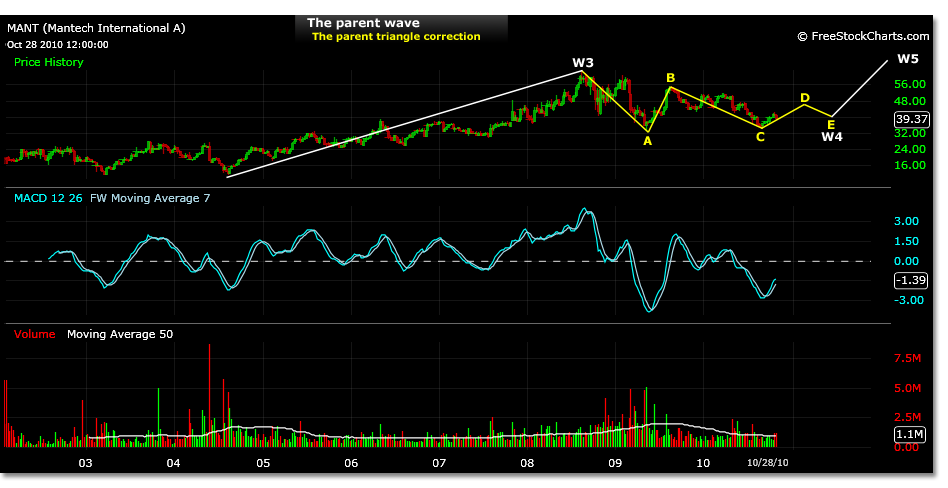
If the chart is showing us scenario 3, in which we have not yet completed a parent wave 4 triangle correction, reference the chart below to the present.
Using the wave 4 correction hypothesis, MANT high of 62.06 would represent the wave 3, which correlates to the MACD wave 3 reading on the monthly chart. Because of the relatively small history available since MANT IPO in 2002 it is not yet certain that wave 3 MACD is apparent. If it were the case however, these numbers would be in play for this chart. Look for MANT to begin its internal wave 1 of wave 5 at a price of 42.44 after extending its current move to 46.36. A correction to this price roughly represents the price zero point for the final 5 waves higher of parent wave 5. These price targets would be 74.05 for internal wave 3 and 93.58 for wave 5. This wave structure would then in turn represent a completed parent wave 1.
This analysis undoubtedly contains many variables, and to execute a trade successfully on a large time frame may be difficult. If we were to choose the initial scenario in which the correction is over, our entry and exit points are clear possibly saving us from greater losses. We can identify a possible internal wave sequence and divergence to a wave 1 peak in the 30 min. chart present day, and can calculate easily within the bullish 5 waves. The beginning of a parent wave 3 would be powerful to the upside.
However, if still within corrective waves of large time frames, as the second and third scenario suggest, we can not make such precise calculations of the internal structures. The resolution of the wave 4 scenario is normally gradual to the upside. The resolution of the extended wave C correction to the downside is usually quite volatile and rapid once the B wave completes itself. Most of these open-ended variables are due to the relatively small price history available since MANT IPO in 2002. By creating some discrepancies within the simplicity of the first scenario, both visually and mathematically, a less stable chart begins to form, but possibly still bullish. The characteristics of scenario 1 can be inherent within scenario 2 and 3.
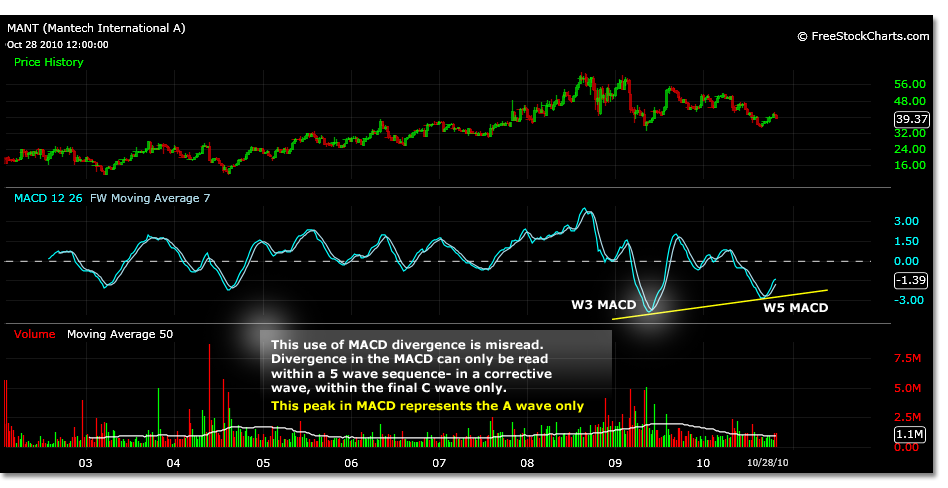
An important factor to consider is that a 5 wave sequence can be apparent in the B wave of an ABC correction. That may be what the charts are showing us from 5/8/09 to 8/21/09 a scenario 2, not wave 1 internal of parent wave 3 as referenced in scenario 1. In addition, the A wave of an ABC correction often is read as a wave 3 MACD mistakenly. The divergence between this MACD reading and the subsequent “divergence” and support in price representing the final wave of C is a misread. Reference the chart below.
Divergence must be read in the final 5 waves of the C wave. In the case of an ABC correction that is expected or not yet completed, the A wave low in price will be surpassed by the C wave and divergence will occur further out on the MACD chart relative to time frame at a lower low in price. If the MACD reading in the chart above does represent the A wave, then a lower low in price relative to this is expected for the C wave referenced in scenario 2.
Yet, this MACD pattern also can represent the formation of a triangle wave 4, scenario 3. In which case the A wave, if completed, does represent the lowest low in price. The beginning of wave 1 of wave 5 will be the first occurrence of divergence and not start until the E wave of the parent wave 4 triangle formation is completed stated to be around 42.44.
The 32.86 price low is important to the development of scenario 2 or 3. By maintaining this support price, as well as the 34.69 price, price motion in MANT would theoretically develop into the wave 4 triangle formation. Breaking these price points, on the other hand, could possibly validate the structure of a larger ABC pattern and further development of a C wave lower. The 34.69 price low is important to the development of scenario 1 as it may represent the price zero point for a parent wave 3 higher. This particular price zero can be re-evaluated if the price goes lower but can also not go any lower than the 32.86 level.
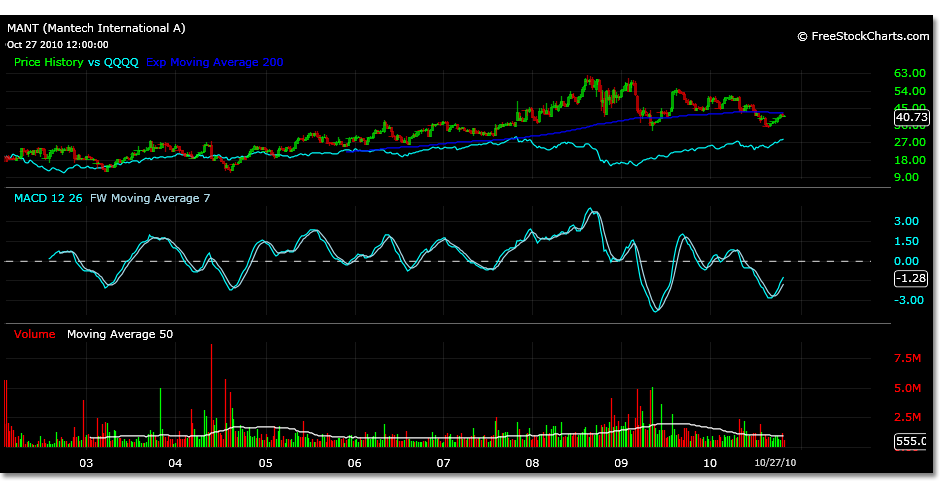
MANT has also made an interesting divergence to the broader markets specifically the Nasdaq that it trades within. In mid 2007 MANT continued making new highs throughout the entire market correction and has continued to outperform the market, yet recently it is trading below its 200 day moving average. MANT currently sits just below this moving average on a weekly chart, it has only once before traded below this level in April of 2009 since the projected initial price zero point of 11.05. As all stocks seem to be making more and more correlations to the broader markets and trading in step, it will be interesting to see if MANT can again diverge from this if a broader market sell off occurs.

