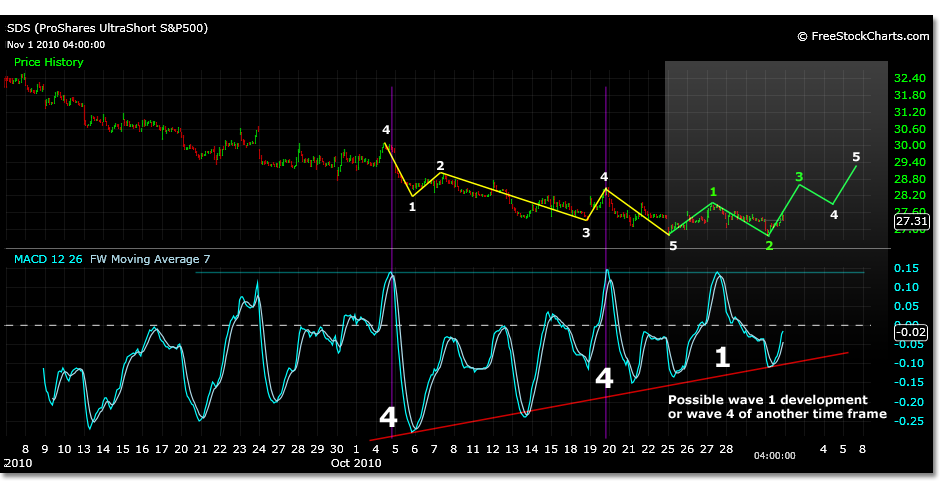
As Barons Decides “Bye-Bye, Bear”, the SDS tests a 52 week low set 1 week ago. The cover of Barrons declares that stocks as a whole will jump 7% by next June 2011, the economy will grow steadily and that President Obama will loose the White House in 2012. That doesn’t leave much to the imagination. Of course the contrarian trader is looking for divergences between big headlines like those mentioned in Barrons and what the actual market signals are telling them.
The SDS has been a big looser lately, but for those looking for an end to the elation that has carried the markets to near 52 week high levels, the SDS today made a small short term step towards the contrarian view testing its 52 week low successfully. At the very least, it left the trader with a possible trading opportunity.
October 25, 2010 SDS trades to 26.76, five days later November 1, 2010 SDS trades to 26.76 as the market trades to near highs then closes flat to lower. SDS has made bottoming patterns like this before at higher levels, but its worth considering the simple entry exit point opportunity presented for a trade, especially as the averages test their 52 week highs today and in the coming trading sessions.
If this wave pattern is the beginning of a bullish trend then SDS may trade to 28.51 and 29.33 if the prior low holds.
There are still price alerts projected from prior wave 4 highs within the SDS wave 5 correction that have not been met at 25.38 and 24.27. The 24.27 low was calculated from a possible wave 4 top to wave 1 low of 30.03 to 28.44.
In a downtrend the final 5 waves of C can be calculated with a 5 wave sequence. If within the final wave C of a correction the MACD wave formation can be used relative to time frame. The largest wave will represent the wave 4. Because the 5th and final wave of the wave C can be projected it is important to be able to locate wave 4 in downtrends. In this case, each wave 4 high can then be used as a price zero to project the final 5 waves lower to the end of the C wave.
If the low were to be in for SDS, the third wave 4 MACD in the diagram would not project to lower lows, but instead represent a wave 1. In which case the next MACD wave higher would exceed the previous levels readings that has been sustained in the divergence to lower prices for SDS and the possible uptrend would develop a wave 3.

