In a world where guns seem to be worth something again, the fundamentalist may persist along side a longterm shareholder of Smith & Wesson. Both now arguing that we never really left that world, and that rational prices in SWHC could reflect a 6.50 – 7.00 stock again. The technical analysis for SWHC at this time is to discover just what happened to the charts during this devaluation and disbelief in guns.
Fundamentally I have not checked into any statistics historical or present of SWHC other than that there were no stock splits. The following is based solely on technical indicators based on Elliott Wave price motion and MACD. These are the technical trading indicators that SST is using to trade the market.
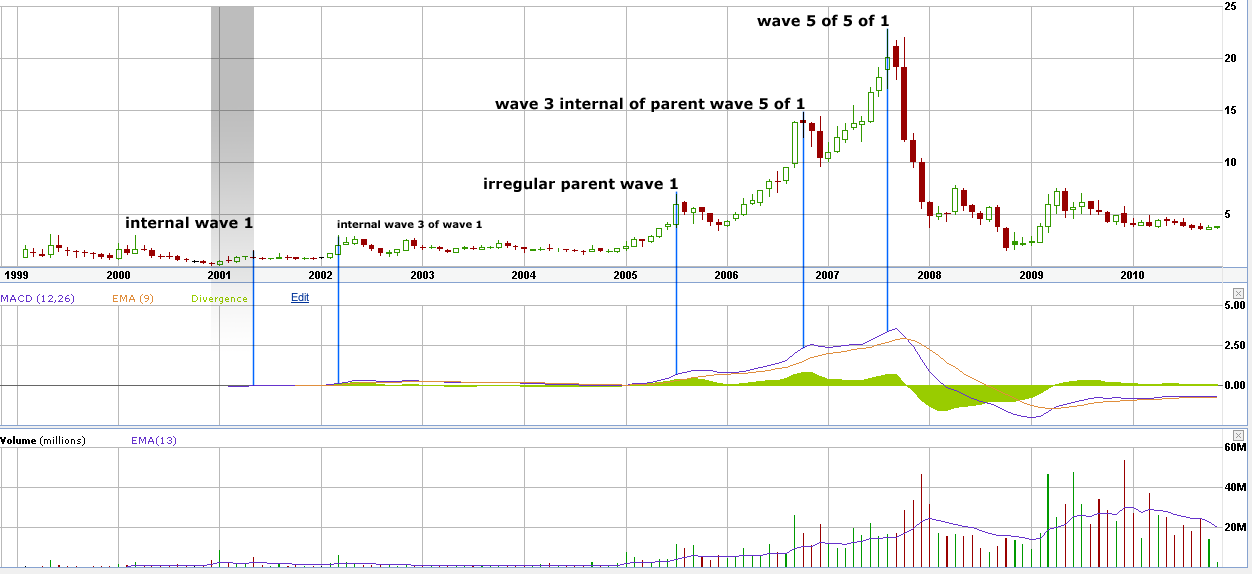
Starting at the annual time frame, SWHC has a highly correlated wave pattern that started at .09 cents in December of 2000. Calculating a wave 1 magnitude from this low to the May 2001 high of 1.51 begins the process of price motion analysis for SWHC to the 22.80 high in August of 2007.
Using this magnitude alone, the wave 5 projection would be 18.67. Not too close, 22% off. But, not too far considering that the projection could have been made in 6-12 months and turned a possible 2065% gain 6 years later. It is not the determination of a successful trader to only be able to discern the past however. Moving slowly forward on the chart, there are further possible calculations that reach closer to the August 2007 high. Sifting through this historical trading can help solidify the analysis as being accurate going forward as well as the theory for using this analysis.
If a calculation using wave 3 of wave 5 is made, wave 3 of wave 5 being the 14.85 peak in late 2006, the correlating wave 5 projection from .09 cents would be 23.97. A 5% difference in the final price motion of 5 waves from the initial price zero point. Certainly if looking closer within the 5 waves of wave 5 projections would have been more exact, but looking at the annual time frame to get the big picture, this is fairly accurate.
There is one other significant high on this time frames chart. The 6.96 high on July 31, 2005. Is this not a wave 1 high? What is the possible significance of this number?
Sticking with our initial analysis, that .09 to 1.51 is an internal wave 1 magnitude of the largest completed trend, the 6.96 price high could represent an irregular parent wave 1. The wave 1 of wave 1 projected is 5.23, which doesn’t show up on this time frame very accurately. However, if we recalculate for an irregular wave 1 the price target becomes 6.90. This scenario still projects similarly to the initial internal wave 1. Showing parent wave 5 price high also at 18.67.
Moving on to the next phase of the annual chart is the obvious correction. Is it a wave 3 top, like the MACD shows? Is it a wave 1 top, since we fairly accurately projected a 5 wave sequence from late 2000 as just described? As stated before, wave 5 is wave 3 of a lesser time frame.
In this case, the time frame is annual. Custom time frames can be constructed to encompass the wave 3 in this chart to be an actual wave 3. For example, a decadal chart based on every ten years. But, for this analysis and presumably the next ten years, we will focus on the 22.80 price high in August 2007 as being a wave 1 unless trading derails this observation.
Wave 1 can correct with severity. They may correct up to 100% of there initial wave 1 magnitude. This is often seen in the smallest time frames, yet SWHC corrected to a low of 1.53 in October of 2008. This trading low was two cents off the initial wave 1 high of 1.51 in May of 2001. In an Elliott Wave analysis this is not a coincidence despite the extremity of the trading. It still does not void the prior wave structure or count in doing so.
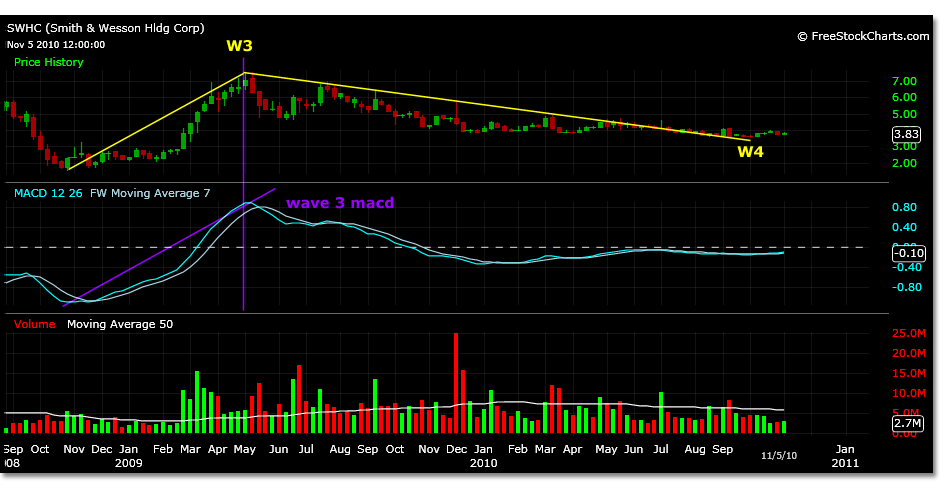
Moving to a smaller time frame and looking at a weekly chart, from the actual 1.53 low in October 2008 to the 3.29 high made in second week of November 2008, a 5 wave projection for this wave 1 magnitude would be 7.89. A trading high of 7.52 was made the first week of May 2009.
At this time frame it is more plausible that this wave 5 projection is a part of a larger time frames wave 3 price high. This wave 3 is seen in the MACD reading on the weekly chart. The subsequent trading from 7.52 may be wave 4 of the larger time frame.
A projected wave 4 A wave low would be 3.83 using actual prices. Projecting this same A wave using the actual 1.53 low and the projected wave 5 high of 7.89 comes out to 3.97. This fairly accurately describes the channel that SWHC has been trading in since September 2010.
If this is a wave 4 of the larger time frame then the B wave price high can be the targeted price point for this scenario. If we measure this B wave using the actual price points from price zero point to wave 3 high, we get 6.13 actual and 6.42 projected. The projected number comes from using the 7.89 projected price high.
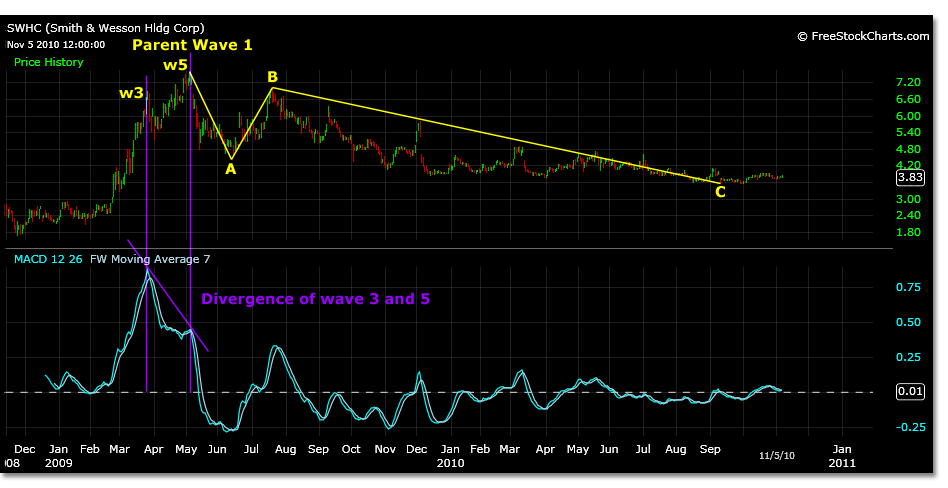
Looking at a different time frame and separate scenario, this wave 4 B wave price target is within the same price range as a projected wave 1 of wave 3 price target of a smaller time frame shown in a daily chart. In the daily chart we can see the divergence of a wave 3 and wave 5 to the 7.52 price.
Using this time frame, the scenario could be for an extended wave 2 simple correction. Wave C of and ABC correction would project to 3.81. From this low, at this point in time the projected wave 1 of wave 3 would be 6.88.
Both scenarios come to similar price targets, however both use different price zero points. The simple correction establishes its price zero point from the actual low of the final wave of C. The triangle correction gets its price zero point for the following wave sequence from the E wave.
The projections are similar because we know that the B wave will have 5 waves like a wave 1, but they are trading scenarios for different trading time frames.
Time will tell whether these corrective waves are completed and ready to move towards their projected price highs.


