The short pullback that was expected in EK this week largely did not occur, and there always is a reason. You can not always just chalk up missed trading calls to market exuberance or market malaise. There is usually always a rational answer for the irrationality of a chart…technically.
Earlier in the week we were looking for EK to pull back to 4.35 or the previously tested 4.46 to possibly create a flat correction buying opportunity, or break this low for a simple correction to around 4.00. If this was to be the case EK would have contained its trading below 4.88 roughly. This did not occur. Instead EK traded back to the 4.88 level and held, testing a low of 4.73 then traded higher today to 4.96 and closed near the previous days close. What does 4.96 possibly represent?
A broader look at the chart of EK can help narrow the results of the last few trading days. There are many Elliott Waves forming at all time frames in this chart. It can be confusing to piece together what part of the trend EK is in when only looking at the last week of market movement. Starting at a larger time frame does help this some. The initial research started in May 2010 and can be followed here to relate to the recent trading low in EK being flagged.
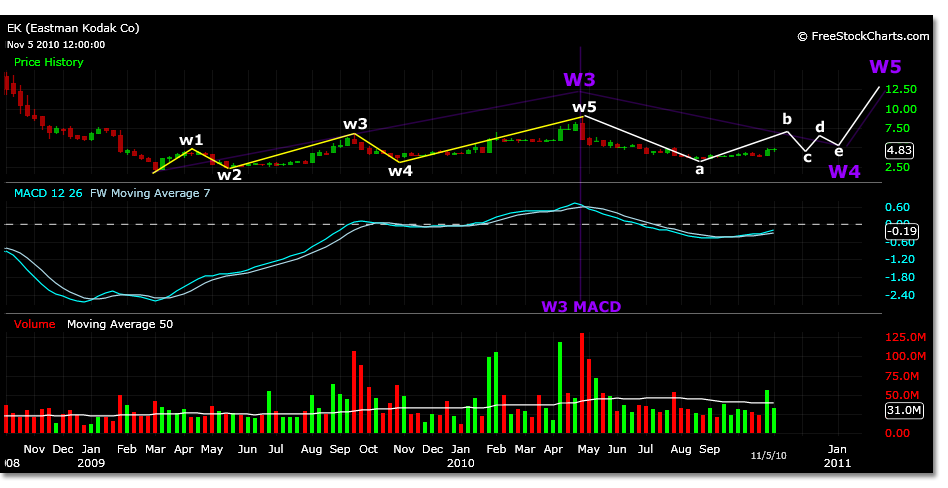
In addition to past projections, the 9.08 top on April 26, 2010, although no doubt a wave 5 shown in smaller time frames, may in fact only be internal wave 3 of wave 5 of a parent wave 1. This creates a scenario where the current trend that EK may be in is possibly the B wave of a incomplete wave 4 triangle correction from the parent wave 3 high of 9.08. This Elliott Wave structure could also contain 5 waves, but will not begin wave 1 until the E wave develops. If this is the case projections for the B wave may extend trading to 7.44.
The alternative to this trading scenario is that the 9.08 top is a wave 1 and the current trend is a wave 1 of wave 3. However, for this analysis we will use the monthly time frame MACD reading to represent a wave 3 completion and the development of wave 4 currently.
The chart below shows that the largest MACD wave since the 2.01 low in March of 2009 correlates to the trading that took place in April 2010 creating the 9.08 price high. Also noted in the trading chart is the internal Elliott Wave structure that existed in this parent wave. The 6.82 trading high in September of 2009 correlates to the internal wave 3 of wave 3. Because the correction following the 9.08 high was beyond 38% and the monthly MACD reading reveals a possible wave 3 top, price motion can be projected to possibly follow a triangle wave 4 pattern.
The chart is not marked to scale on these projections relative to time. Prices projected are from the actual 2.01 low and the 9.08 high correlating to a wave 3. The B wave of this triangle formation is projected to reach 7.44. Wave 5 should start at 6.36, the E wave of the triangle and possibly reach 13.45. Internal wave 3 of this parent wave would trade to 10.74. These are projections using the monthly trading time frame price motion.
If this is the case and trading continues to the wave B high, as mentioned earlier, the B wave triangle will form five waves that lead into the present day charts.
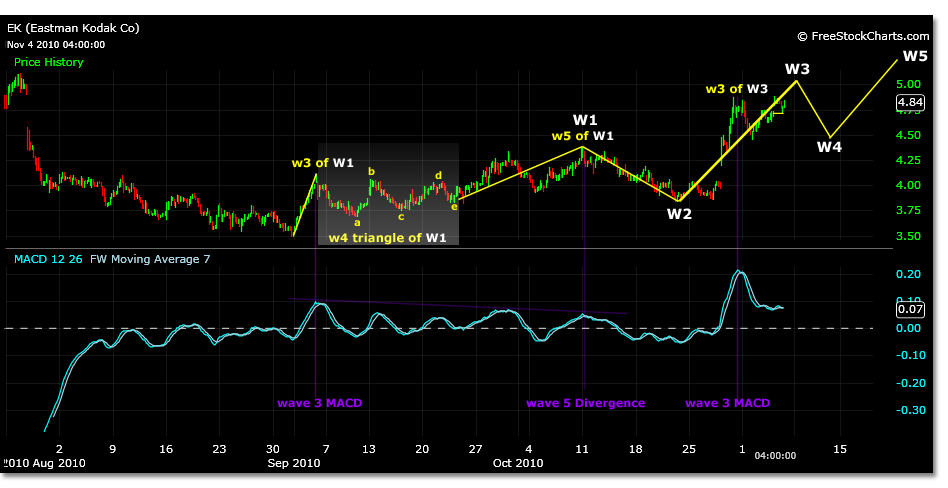
The wave count should be started from the 3.49 trading low on 8/31/10. The next trading high of 4.11 is a wave 3. From this wave magnitude a projected wave 3 of wave 3 price high target could be 5.02. This could be where EK is trading today, November 5, 2010 by hitting the 4.96 mark. An expected correction may form to the 4.58 level or perhaps as low as 4.05.
After wave 4 is completed and does not surpass the wave 2 low of 3.84, EK is projected to trade to 5.73. This will be internal wave 3 of the 5 waves projected to be a part of the larger trends B wave to 7.44. So far, the actual price motion projections bring the wave 5 target to 7.12-close to the B wave target. The internal wave 3 of wave 5 target is 6.26. These projections are again for the B wave scenario price target.


