
First it was up, then it was down. Just yesterday we made price projections for WATG that expected more bullish trading. Today WATG traded down over 12% after trading up 6% in premarket to 12.00. What happened? Earnings came in short of expectations missing by .01, but that really doesn’t explain it.
The prior chart analysis of the daily time frame was confusing and most likely wrong. WATG does not seem to want to give up the goods very easily. There are definitely trends within the prior analysis that may correlate to future moves, but there was something missing in the mark up of the charts, something misread and it could explain whats happening now and be added to the scenario. Trading the present is the only way to trade successfully.
Today WATG trades down to 10.06. This was a big move, but this was also around the projected wave E of the triangle that WATG was so messily putting together. This could have easily been the retest of the price zero point we analyzed occurring on the week of 10/15/10 on 6 million shares.
WATG rebounds off this low nicely for most of the day, then at 1:30 in the afternoon lets go of that support falling further to a low of 9.80. This is saying two things.
One, the wave E triangle price point was not the projected price. Meaning it was hidden within the trading that followed the prior peak, but wave 1 projections to 13.72 are still intact. We need to dismiss this option not because the wave count was not plausible but because the numbers, projected as they may be, just don’t add up anymore. WATG should not have broken that 10.00 area if it were so. Maybe the 9.02 low of that week of trading (10/15/10) should be considered as wave E support, but that leaves a lot of numbers missing still.
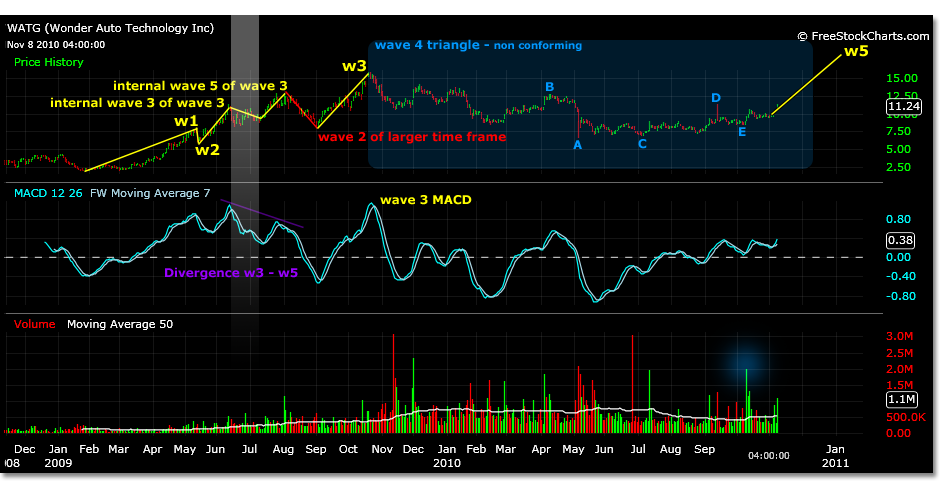
Two, the larger trends triangle is in play and did not reach the 12.61 wave B peak mentioned because of earnings. A larger time frames wave 4 is developing from the 2.05 low to the 15.78 high. The A wave completed itself at 6.58 on 5/6/10 and the B wave fell just short of expectations today trading to 12.00 instead of 12.61.
These two things were discussed as possible projections in the prior analysis. They are not any bigger a surprise then the 12% correction itself. But realizing this, is option 2 anymore secure of playing out after todays trading action?
The larger time frame is still in play for WATG today, but there is another scenario that could make more sense of the internal waves trading action. Since we can say that we lost track of the internal wave count of WATG, but possibly not the bigger picture, lets try and dive back into the daily time frame. What if the 15.78 price high is not a wave 3, even though the MACD shows this to be the case?
Take a look at the second chart in the previous analysis that describes the internal structure of wave 3. Notice how the divergence between waves 3 and 5 is vividly clear. Then, the red markup of wave 2 of a larger time frame appears to be the answer to the next stretch of trading. Possibly not.
If the divergence is established and the correction is established to have begun, lets look at the trading from this point forward. For certain there is always volatility in charts that can create resolution to another time frames price motion and cloud the picture, but what really is this wave 2, why does it end in the MACD with a single wave? What is this wave 3, why does it not have divergence in the MACD like the prior wave peak?
What is being suggested may become more obvious if you move your charts history forward in time to the point referenced by the divergence- this is the 12.83 high on 8/4/09. The chart below shows this peak labeled wave 1 in yellow as wave 5 of wave 1. Now look forward for the correction.

From 2.05 to 12.83 a 38% correction would be 8.70. WATG trades to a low of 8.10 and closes at 8.71 on 9/2/09. This suggests that WATG will trade within a simple ABC correction or flat correction. The B wave will reach to 11.26 and the C wave will reach to 6.16 in a simple correction, unless the 8.70 level holds for a flat correction.
WATG trades to 11.53 on 9/17/09. Perhaps the B wave of a simple correction. Then consolidates and trades higher to 12.58. Perhaps an expected flat correction. Corrects briefly, then shoots higher trading to the 15.78 high.
Supposedly this is a wave 3, because the MACD surpassed the prior peak. This could be mistaken analysis. The wave 2 ABC correction may never have been completed before the 15.78 high. The B wave traded to projections, but then something happened and WATG may have made an irregular wave 1 peak.
It is actually pretty rare to see a wave 1 irregular peak, but this was also a wave 5 peak obviously, in that the move from 2.05 to 12.83 completed 5 waves of the parent wave structure.
If an irregular wave formation is calculated using this magnitude, the new higher peak, which is also now still the B wave of the correction, comes out to 16.34. 3.5% difference to actual 15.78. The wave C of the expected correction is 6.16. This could correlate to the 6.58 price traded on 5/6/10.
If we use the new wave structure projected, a wave 1 peak of the wave 1 of wave 3 of wave 3 is 11.69. WATG did trade to 11.50 today.
Now it becomes even more important to know what time frame is in play and what your trading parameters are. This new trading scenario for WATG seems to correlate better to the internal wave structure than the past analysis, but the larger trend seems to be the easiest to track so far.
Trading should be supported at the 9.44 level if a larger monthly time frame is reading the 15.78 high as a wave 3 and the B wave has formed in the wave 4 triangle as noted. Also notice that in this scenario the A wave would also be the lowest low in MACD, characteristic of a triangle, at the 6.58 price.
Trading may be supported at the 9.58 – 8.27 price levels. 38% and 62% corrections respectively of the wave 1 projected 11.69. A wave 2 can correct up to 100%.