Leap Wireless International (LEAP) is a long way from the long term profit level set in early January. This trade hit the sell stop only a few days after the trading signal, but regained enough of its upward momentum to set off the short term gain expected for 11%.
LEAP traded nicely in the February 2010 setup, hitting both price targets for very nice gains. A 38% gain long term.
Then in late May 2010, LEAP was showing another possible trading signal off a longer term triangle. This trade also got stopped out a few days later and the selling really accelerated breaking through all support levels.
Since the price highs mid April 2010, LEAP dropped 96% to 9.51 on 8/12/10 after a high volume day of over 21.5 million shares, almost 8 times the normal average back then.
LEAP has been volatile enough to make large gains, but also has been continuing its downtrend. This is certainly something to be concerned about when looking to enter a bullish trade. When the chart you may execute a long position on reads from the top left to the bottom right, you better be sure you’re disciplined in your approach or just steer clear.
LEAP is showing signs that it may be exiting another triangle formation and heading towards higher prices. Not likely to reach the 21.21 price target any time soon, but 13.00-14.00 range possibly.
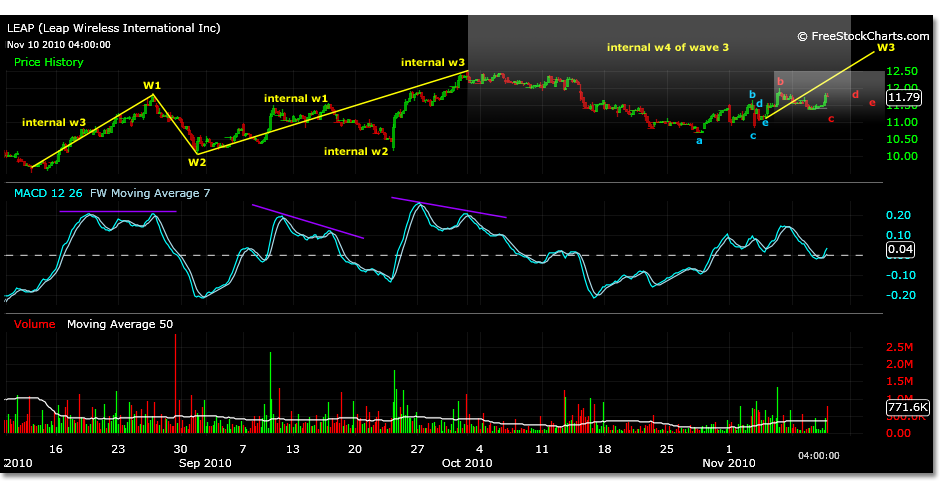
The chart below sets up the possible Elliott Wave formation to trade off the 9.51 low. Right now LEAP may have just exited its wave E triangle price point and be trading higher in wave 1 of wave 5- projected wave 1 price is 12.16.
It’s not certain that the wave 4 triangle is done forming. In the chart there are two possibilities shown in the shaded area. In the light blue type the triangle has formed rapidly and beginning to trade its wave 1.
In the red type is a projection of a slower developing triangle based on more accurate correlations to the projected price points of the triangle. The following numbers represent the triangles price points projected from 9.51 actual to 12.48 actual.
Wave 4: Triangle
A wave: 10.65
B wave: 11.79
C wave: 11.10
D wave: 11.56
E wave: 11.33
Wave 5 of wave 3:
Internal wave 1: 12.16
Internal wave 2: Fibonacci retracement levels
Internal wave 3: 13.17
Internal wave 4: Fibonacci retracement levels
Internal wave 5: 14.31
Triangles are hard to enter without risk. They do not conform to an Elliott Wave 5 wave sequence with regularity outside of the B wave. Still, there is 22% gain to be had here if the price motion follows through to complete a wave 5. If this is a triangle formation within the B wave of a corrective ABC wave of the larger downtrend, then the triangle will break violently to the downside to complete wave C.
One safe way to enter a triangle trade is to wait until the wave 1 internal of wave 5 has formed. This will be a projectable 5 wave sequence and the correction that follows will be more evident as part of the uptrend than the sideways trading motion of the triangle.
There will also be real divergence at the price projection of wave 1, and the B wave high will have been surpassed. This approach may limit the upside potential minimally, but hopefully allow a trader to easily sight an exit point at the actual price zero point of wave 1.

