DRYS traded up about 11.5% today to a high of 5.79. Earnings were released last night after the bell. Reports Q3 (Sep) earnings of $0.38 per share, excluding non-recurring items, $0.13 better than the consensus of $0.25.
DRYS has always been volatile and traders have liked it in the past for its readily available tradable swings. Hopefully it will become a more reliable Long with these good earnings out and attract larger traders as the volume suspects.
A look at the chart says a lot more than the news although its nice to see a company with a positive outlook and results to back it up. SST has speculated about DRYS and the shippers with previous analysis, but only attempted one trade that was unsuccessful. The trade signal came right before the stock let loose for the deep sea floor, trading 61% lower past our stop price.
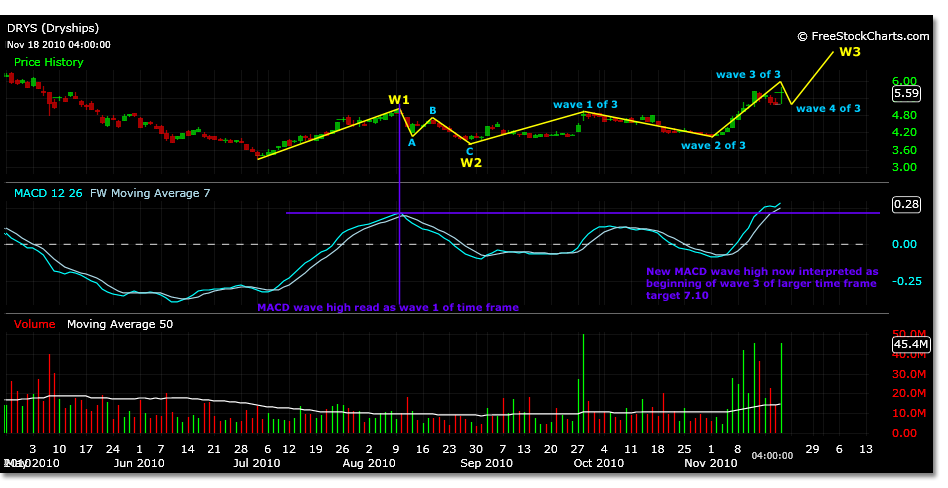
DRYS today is basically back to the highs of late April 2010. A look at the Elliott Wave pattern that has developed since the 3.28 low on 7/1/10 seems to show more room to the upside for the intermediate term.
The most positive thing about DRYS currently is that it appears to be within its wave 3 according to the daily chart MACD. This will be the most rapid of the bullish price moves that DRYS will enter over the stated time frame.
DRYS traded to 5.79 today, a possible wave 3 of 3 top with a price projection of 5.89. There is a possibility of a spike higher before a correction occurs. With this type of volatility it is hard to say how much the price will swing between internal wave targets, however parent wave peaks and troughs should be met if the wave count is correct to the trend.
The chart below is a daily time frame chart and shows one of the current Elliott Wave counts thought to be developing in DRYS. The projection for the price point of 5.89 is projected by using the actual 3.28 low of 7/1/10 and a parent wave 1 high of 4.99 on 8/10/10. From the parent wave 1 high of 4.99, DRYS trades to a wave 2 low of 3.92 and a 62% correction to wave 1. Wave 3 of the internal count is in play right now at 5.89, and wave 4 and 5 projected.
There is more evidence of what may be developing by looking at another time frame, as every wave 3 is a wave 5 of a smaller time frame. In our stated wave count, the initial wave1 high is 4.99 on 8/10/10, but looking at the daily chart there is no divergence of MACD to this price high. It would appear, if you cover the future prices from this point, that this MACD high is a wave 3. And, it has been until the latest move to 5.65 breached this MACD high signaling a wave 3 move of a larger time frame.
What this means is that at a smaller time frame the wave count and structure changes, obviously. But, it also shows the detail that is lacking in the 5.79 high of today and can pinpoint intermediate price targets that may be ahead.
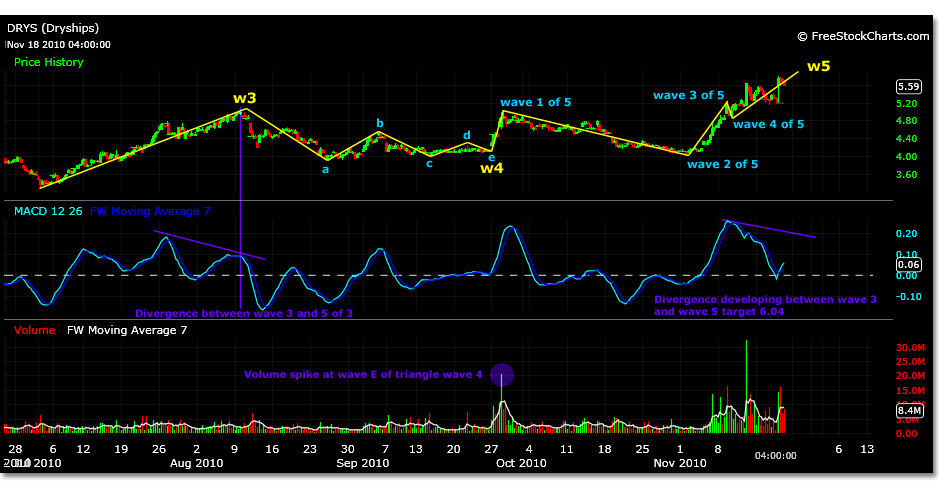
By looking at the 2 hour price chart below notice how the framework of the technical analysis changes completely. Trading is confusing because time frame interferes with objectives or vise versa. If you can isolate your time frame within your trading objectives it is less likely to become lost in a trade.
In the two hour chart the first peak at 4.99 is a wave 3. Instead of a simple ABC correction occurring to the 3.92 price low, a triangle correction occurs. The 3.92 low becomes wave A of this wave 4 triangle. Notice the volume spike at the wave E target price of the triangle at 4.33, the beginning of wave 1 of this time frames wave 5. The wave 3 of wave 3 projected price high, at this time frame just happens to be 5.789.
Wave 4 of this internal wave 5 is projected to be 5.63, which traded already today towards close. Wave 5 is projected at 6.04. This will then again be the internal wave 3 high of another time frame and so on. Corrections to the 6.04 level are projected to be 4.99 and 4.33, 38% and 62% retracements of the parent 5 waves.
Back to the first chart and wave sequence. A correction using the internal wave 3 structure from the daily time frame chart, would target a wave 4 internal of wave 3 at a projected 5.13. Because wave 2 of this internal move corrected almost 100% it could be less severe. This would bring DRYS back to were it closed on Wednesday 11/17/10.
The daily chart wave count also projects wave 5 of 3 to reach 7.10 and wave 5 of 5 to trade to 9.46.


