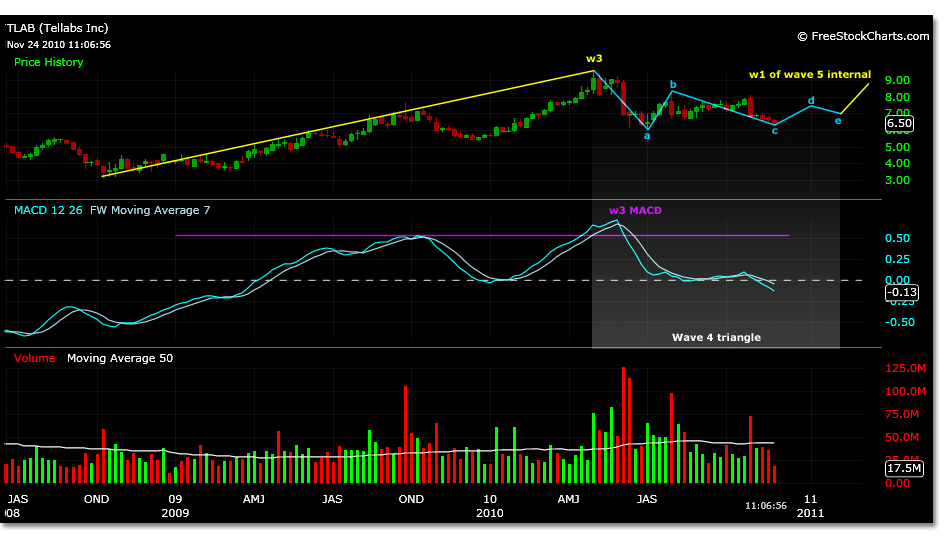
Tellabs Inc. was on the watch list recently as a possible part of the seasonal move for telcom and communication service providers into year end. Today a buy signal was initiated on the analysis that a wave 4 triangle correction may be completing its C wave in TLAB, which could mean trading to higher prices.
A lot of trades are being based on wave 4 corrections of late. When the trading price motion of the equity surpasses a 38% correction of its wave 3 magnitude it is expected that a triangle will form. A trader should enter a triangle trade with caution, as a triangle may also form within the B wave of a simple ABC correction in which the triangle will exit its E wave to the downside.
In the TLAB chart and trade setup, it is being assumed that the A and B wave of a bullish wave 4 triangle have been completed and the current price motion is representing wave C of the triangle.
It is worth noting that the projected low for the triangle correction from 3.10 to 9.45 is 5.54. This price is the projected low for the A wave if it is not yet complete. The 6.10 low is just off a 52% correction of 6.15, also a common percentage for wave A triangles. If the 6.10 low does not suffice as the A wave low for TLAB, another 10% to the downside could be in the works.
Using the 6.10 low as the A wave low it is fairly easy to spot the triangle formation on a weekly chart. The price points that follow are projected.
Wave 4 triangle price motion:
A wave-projected 5.54 actual 6.10
B wave- projected 7.99 actual 8.19
C wave- projected 6.52 actual 6.40
D wave- projected 7.50
E wave- projected 7.00
Wave 1 of wave 5 internal projection is 8.76. This is the long term price target for TLAB using the wave 4 triangle trading set up.

