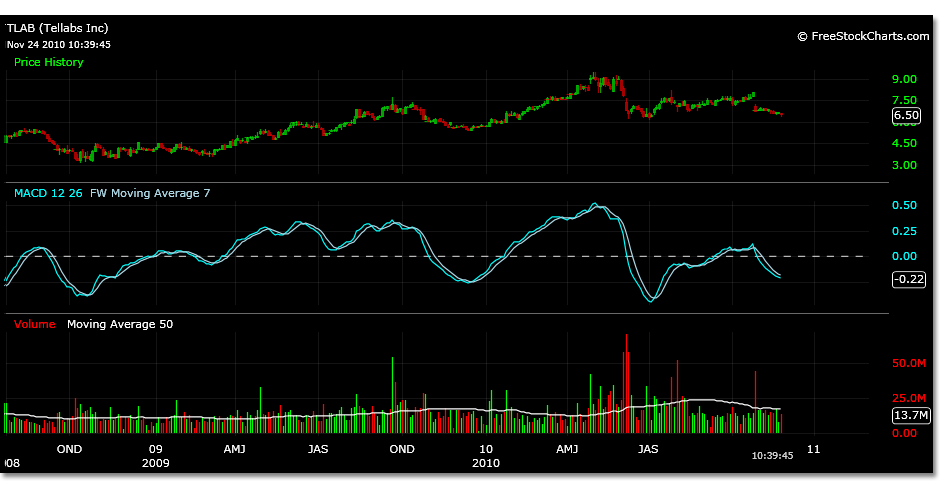
| Buy signal trading TLAB- November 24, 2010* | |
| Trading signal for weekly price bars | |
| Buy price: $6.50 | |
| Sell stop price: $5.99 | LEVEL HIT – January 25, 2010 |
| Short term profit level: $7.49 | |
| Long term profit level: $8.75 |
|
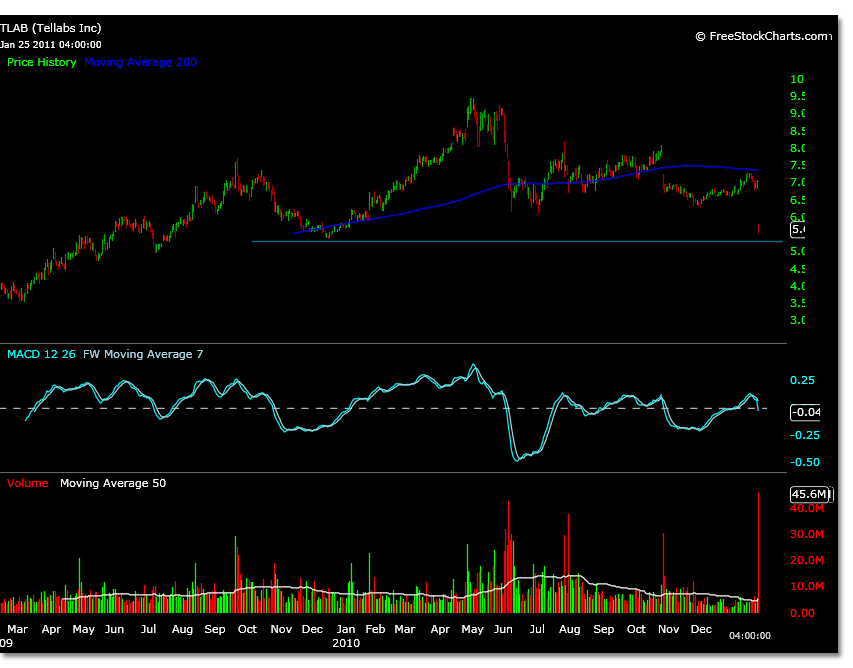
Tellabs traded within 2% of the short term profit target and appeared to be correcting normally with a strong bid the past few days, however todays open 20% down did not allow for a limit sell stop at 5.99 to be triggered. This type of scenario can occur and it is a good idea to create a new exit plan at this point rather than sell into the panic, although this opportunity does not always present itself in some instances. Looking at the TLAB chart it appears that there is some longer term support at the 5.36 level. This level is shown in the sell stop chart with a blue line. Trading below this level could be an indication that further sell off will continue and to take losses at these levels. Support here could mean a reversal to the median of the range, towards the intended sell stop level, and a better exit point before these levels are tested again. Todays price level was mapped out as a possible parent wave 2 in the following post (with diagram) as part of a possible uptrend. |


