
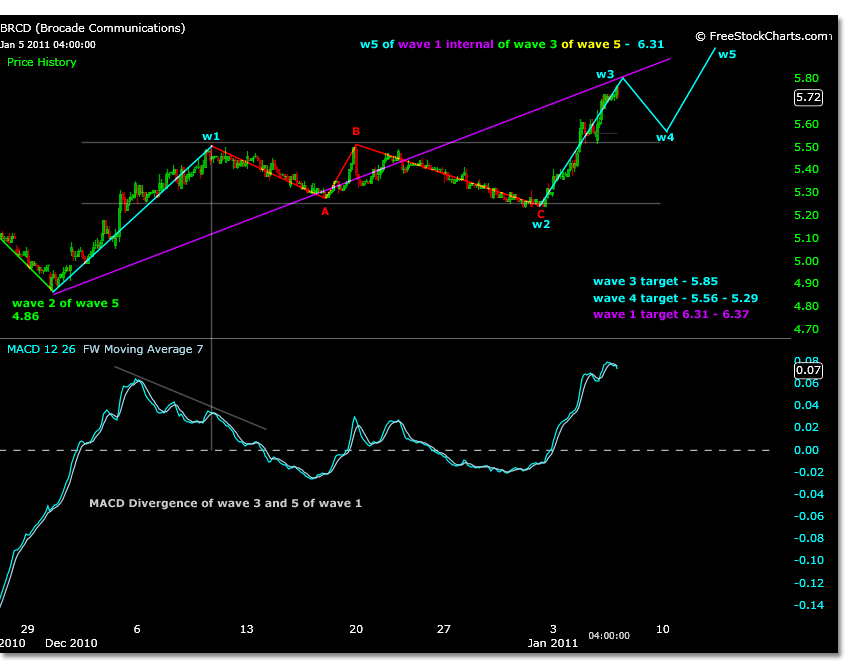
Brocade is up 3% so far today. In early January 2011 a Brocade chart was marked up with price projections and analysis for an Elliott Wave count beginning off the 4.64 low on 8/24/10, but specifically continuing off the 4.86 low on 11/30/10.
The price projection for wave 3 of 5.85 was reached and exceeded, trading 6.01 on 1/14/11.
Both flat and triangle wave 4 projections were previously given. Currently BRCD has traded within a flat correction. If considering the projected price targets as ranges for this correction, the range is fairly accurate.
This flat correction is shown in the chart below. The wave 4 flat correction range is shown with the parallel gray lines, and marked in red.

This flat correction is less likely to hold though due to alternation in correction percentages being a common rule between waves 2 and 4. The prior chart shows that the wave 2 correction was flat, this means that lower price targets for wave 4 are expected unless wave 3 is exceeded.
One possible wave formation to reach these lower prices could be a triangle within the B wave of a simple correction. This formation does not normally occur within a wave 4, but this could be a wave 5 correction within a separate time frame.
The chart below is 30 minute time frame and shows how the previous projection for wave 5 is reached within this triangle scenario shown in orange.
