
LEAP has been trading very close to Elliott Wave projections.
This trade was based off a triangle wave4 A wave projected target of 11.45. The B wave target is 13.39. The analysis for these scenario can be found in the prior post.
The 1 minute trading time frame chart below shows the potential 5 waves of B projected in white type and trend lines. Price projections that have not occurred yet are grayed out.
These projections are used to calculate the price targets for the trade signal issued for LEAP.
Internal wave counts and price projections, using actual prices and not projected, will vary and are not shown.

All charts at SST can be right clicked to be viewed at 100% if your screen size does not allow this and auto sizing creates resolution issues.
Trading today in LEAP came very close to the wave 3 projection and the price target of 12.60, trading to a high of 12.54.
Tomorrows trading may not test this high before correcting, however at this time the trading action seems to be supportive of a complete wave sequence based on Elliott Wave correlations so far.
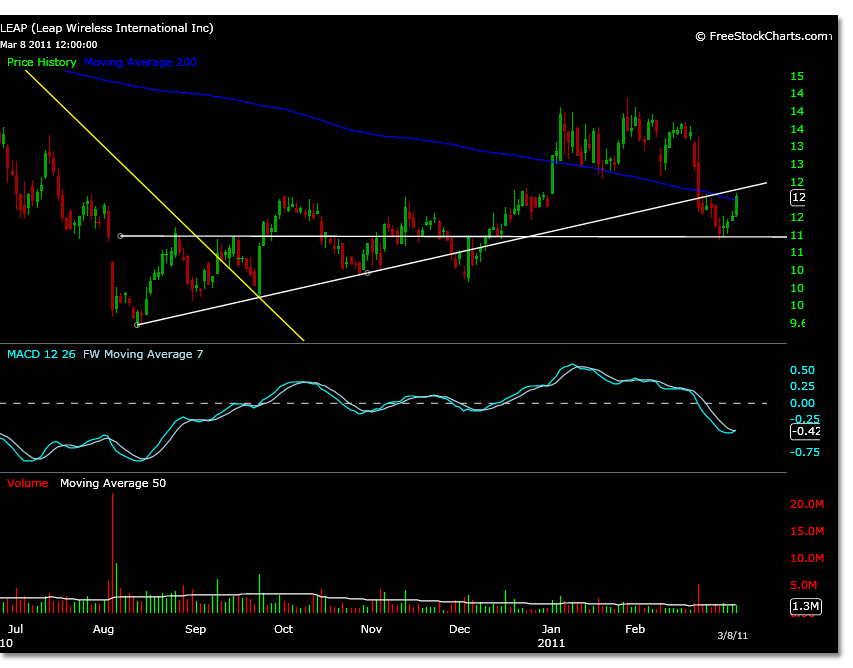
LEAP has ignored broader market moves lately trading higher during the past two down days of market trading, but currently faces resistance at its 200 dma as well as the prior uptrend line broken now above, shown in this chart.
The internal wave 3 of 3 macd reading shown in purple type may show greater divergence to the 12.66 projection at the 1 minute trading time frame if a higher high occurs before an anticipated correction.