
The RIMM chart since the 12/02/08 low looks a little disorganized from an Elliott Wave point of view, although it has maintained an attractive magnitude of price ranges to trade.
RIMM was part of the telcom seasonal trades, but we have not analyzed the chart beyond its duration period correlations in the past.
There have been very attractive trades to be had in RIMM, almost 145% gain on the way up from the 12/02/08 low to the highs of June and September 2009.
Also, on the short side showing almost 95% gain from these highs to the more recent lows in September 2010.
Again, from an Elliott Wave perspective, at first glance this chart does not appear to have the responsiveness needed to trade frequently under the Elliott Wave parameters. As well, most of the largest moves lack volatility, which is important to determining the validity of price projections.
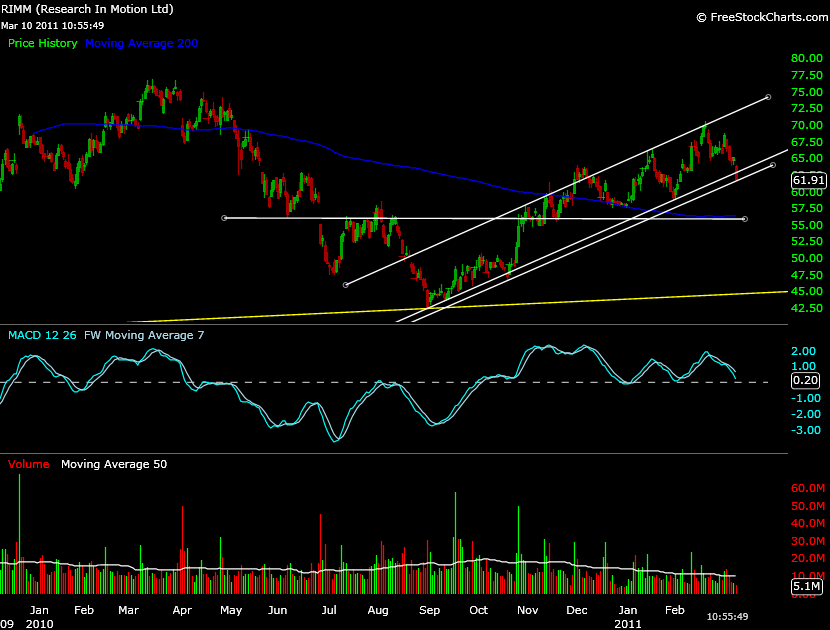
Yet, an attractive uptrend has been established in September of 2010 and some of the past price motion has correlated to Elliott Wave price projections.
There is reason to believe, using a prior Elliott Wave count, that the current price action could be headed higher.
The price motion between 12/02/08 low and the September 2010 lows is what establishes the price projections for the current trend.
The low of 35.09 on 12/02/08 will be used as the price zero point. Although this low is taken out by 4 cents as it was tested, after reaching a high of 60.47, in this analysis the magnitude of wave 1 will be established using this range.
Doing so creates a parent wave 3 and wave 5 projection. The calculations for parent wave 3 come to 91.84 and wave 5, 126.91.
The correlation to a wave 3 target is not exact. The highest RIMM reaches is 88.08 on 9/24/09.
But, if less absolute price zero and wave 1 high prices are used, possibly closing prices, the projection is quite close to where RIMM has topped out so far.
The 4.2% difference of projected price to actual, compared to the potential of capturing up to a 145% move is fairly accurate.
This puts RIMM into a possible wave 4 trading scenario. Flat or triangle corrections are possible. On 6/12/09 RIMM created one of its wave 3 tops, the other established on 9/24/10 closest to projections.
Between these two tops it appears that RIMM tried to create a flat correction scenario. As the initial correction was close to a 38% correction in the 70.00 range.
Support was established at this price target again, after the 9/24/10 top. Holding this low would have created a move higher towards wave 5.
It was expected, relative to Elliott Wave alternations, that wave 4 would be flat or shallow, because wave 2 was a 100% correction.

Something happened on 10/28 and 10/30/09 in a sharp selloff that took out these lows and triggered either a triangle wave 4 formation, or perhaps a larger time frames wave 2 correction, since the price zero low was technically taken out.
The scenario for the wave 4 triangle seems to be more relative because wave 4 can appear very disorganized and the initial wave 1, 2, and 3 are clear to see using this scenario marked in yellow.
The triangle wave A projection initially was met quite accurately on 11/3/09. The projected price was 56.91.
Wave B was projected 78.74, met accurately on 3/15/10.
Wave C was projected 65.64 which was met with support at the 200dma on 5/10/10, but then again something happened to create a sharp selloff. On 5/20/10 RIMM fell sharply and eventually traded past its wave A low to a low of 42.53 on 9/1/10.

The triangle formation for wave 4, although somewhat apparent in the past price motion, has failed to support price projections since the break down of wave C.
However, todays trading action seems to fall back into play for the parent triangle wave 4 formation, at least from a price motion stand point.
Realizing all this could change very quickly, todays trading low, so far, is accurately supportive of what was the C level of the prior triangle move that broke down on 5/20/10. This is also roughly a .618% retracement of the recent high of 70.54 from the projected wave A low, roughly 55 actual.
If higher prices continue for RIMM, these turning point prices could be used to piece together the price motion projections of expected wave 5.
Using 35.09 and 57.08 a less absolute magnitude of parent wave 1 to calculate the triangle wave 4 correction (57.08 is used as a estimation of average high to the exhaustive high of 60.47), the following Elliott Wave projections form.
Wave 3 projection – 84.26
Wave 4 triangle A wave – 54.00
Wave 4 triangle B wave – 72.91
Wave 4 triangle C wave – 61.56
Wave 4 triangle D wave – 69.13
Wave 4 triangle E wave – 65.34
Wave 1 of parent wave 5 – 78.97
Wave 2 of parent wave 5 – 70.55
Wave 3 of parent wave 5 – 95.81
Wave 4 of parent wave 5 – 84.17
Wave 5 of parent wave 5 – 114.65
It is important not to try and fit the data to the theory. At this time an optimal price motion chart for Elliott Wave is not apparent, and RIMM is perhaps not following a wave count.
In this case, Elliott Wave is simply being used to support price projection for the current trend which has been supported by a channel (chart). This support may be linked to past wave formations which were accurate up to 4.2%.