LEAP has been on a tear after it corrected from its triangle wave 4 low of 11.48.

All charts at SST can be right clicked to be viewed at 100% if your screen size does not allow this and auto sizing creates resolution issues.
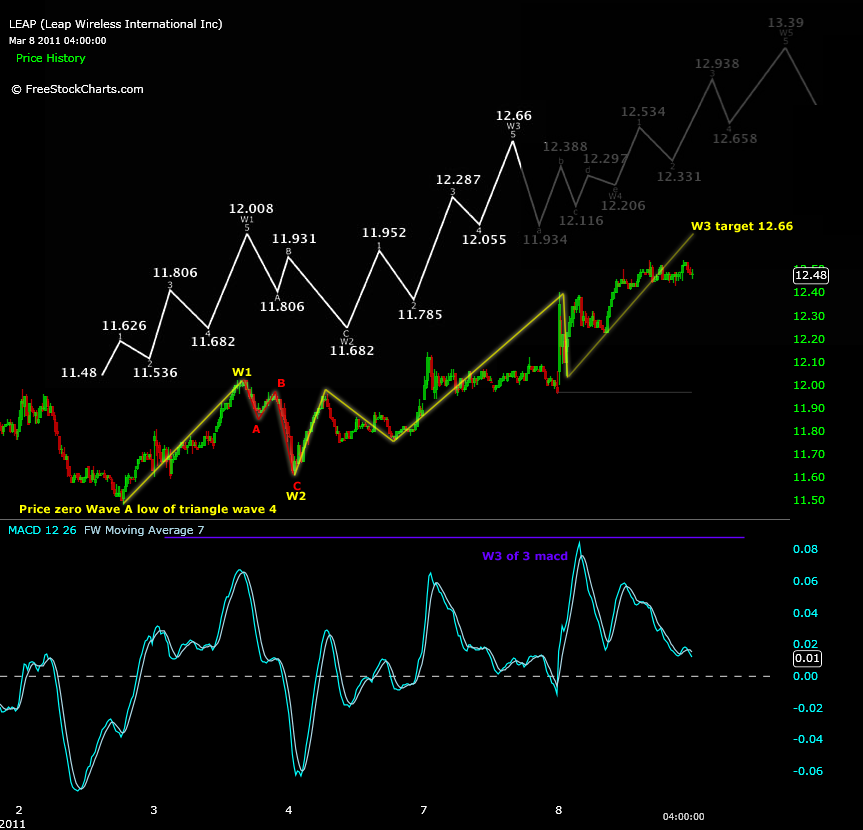
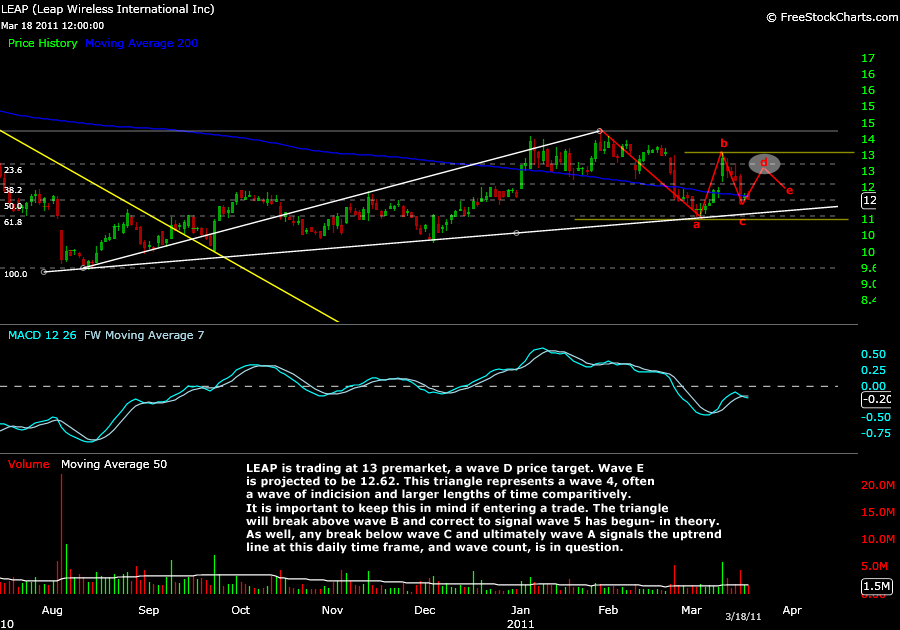
The chart above is from a previous analysis, and shows the move off the triangle low to the wave B high that set up great anticipation for points of entry to the latest move.
The last crack in price was at the wave C low at 11.92.
From there LEAP did not make typical wave 4 indecisive moves. Given market dynamics at that time, this was a tough trade to buy into 3/16/11.
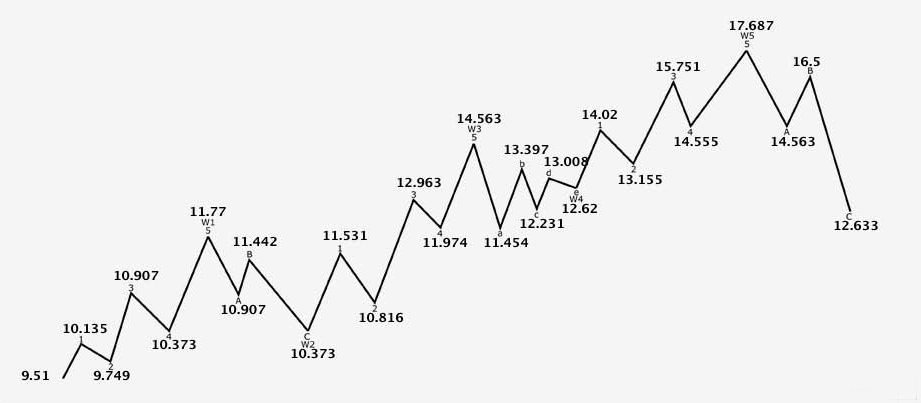
The calculations chart below shows the 5 waves projected from prior analysis of LEAP.
If correlations are to remain relatively near to Elliott Wave projections, LEAP has just reached an internal wave 3 of the parent wave 5 price target today.
This price projection is from the original wave 1 off the 9.51 low, initially spoke of March 3, 2011.
An internal wave 4 correction at this point seems likely and market dynamics will predict its severity.
To review past Elliott Wave analysis on LEAP or any stock ticker of interest, use the meta tag link or search for ticker in search field.


