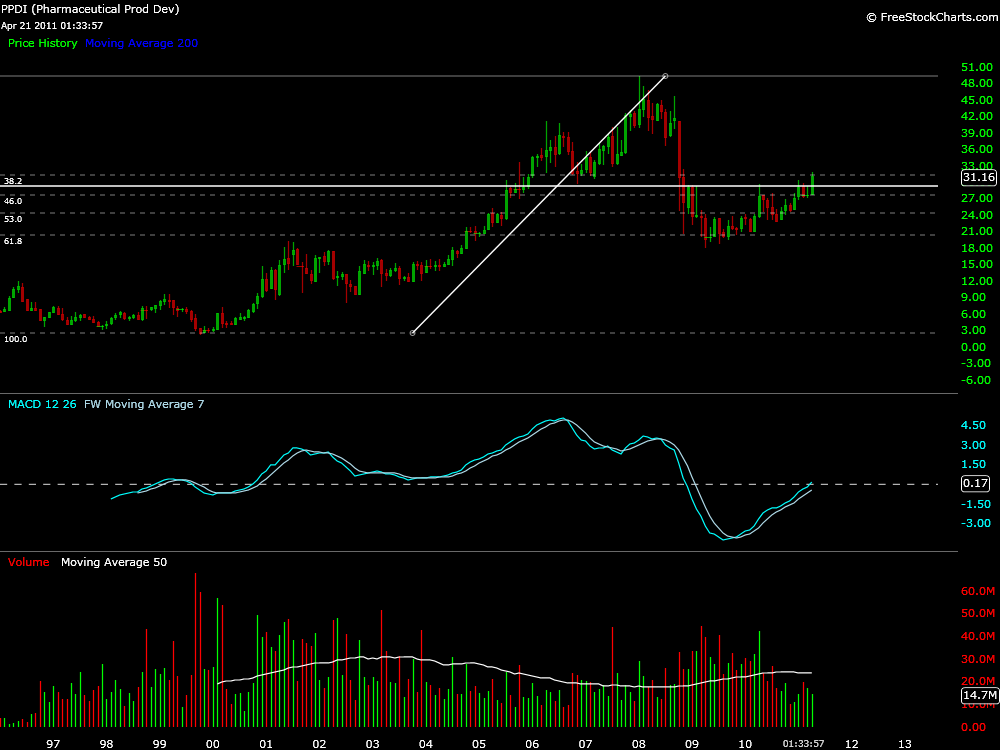
PPDI (Pharmaceutical Product Development Inc.) was giving me plenty of problems from the sidelines and at just about every time frame (post). But another look at the bigger picture compelled me to enter a trade today at 31.02.
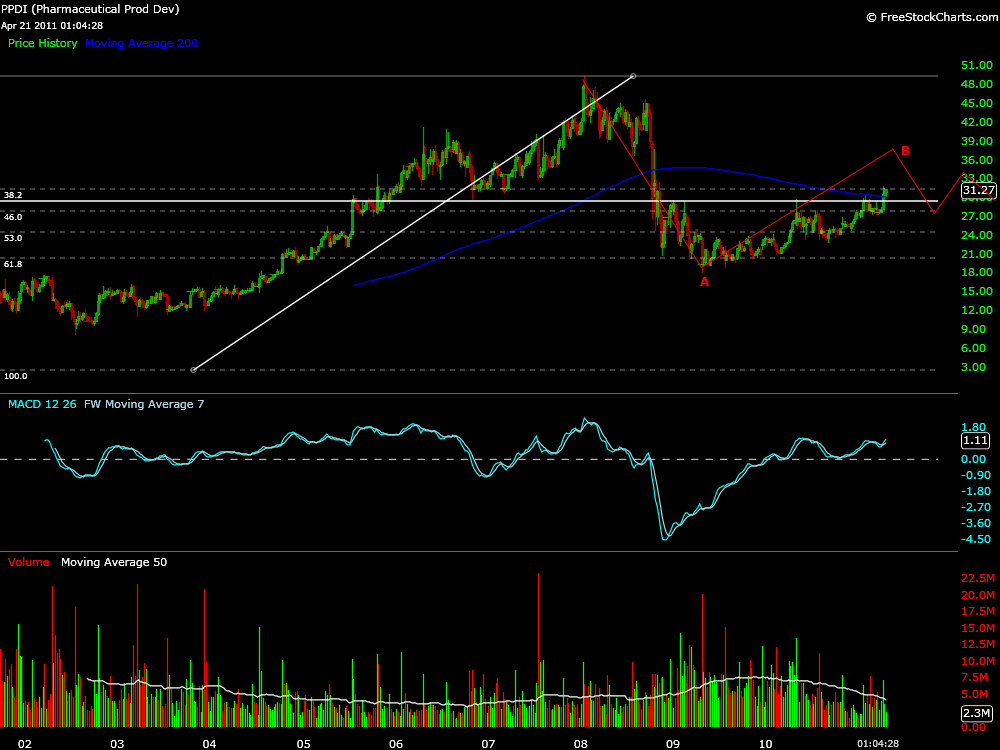
I’m looking to hold this till 38.00 or stop out below 29.
From the low to the high in PPDI on the monthly the correction correlates to a .618% correction. With this percentage correction I am going to expect a triangle to form.
Below is the weekly chart that I’m basing my levels on and how I’m getting my initial price target. The A wave began at 19.03 in May of 2009, the B wave price target is marked.
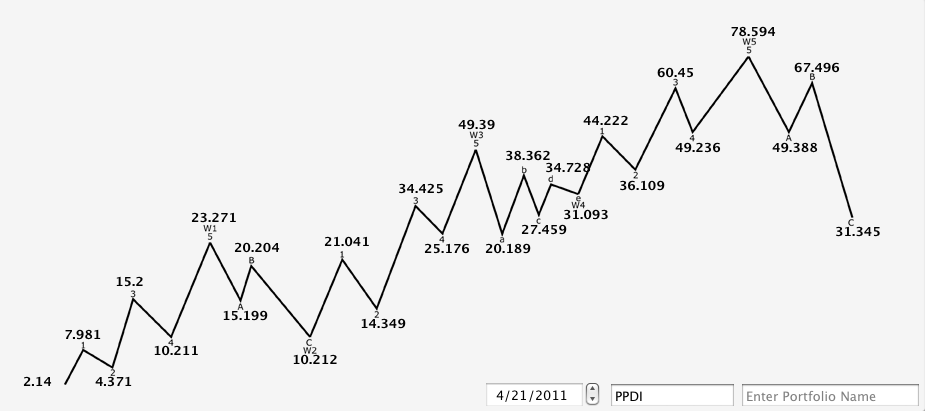
The price projections chart below shows how the triangle correction projections are reached using the absolute low and absolute high of PPDI.
These price levels are more likely to be relative to the monthly trading time frame if played out.
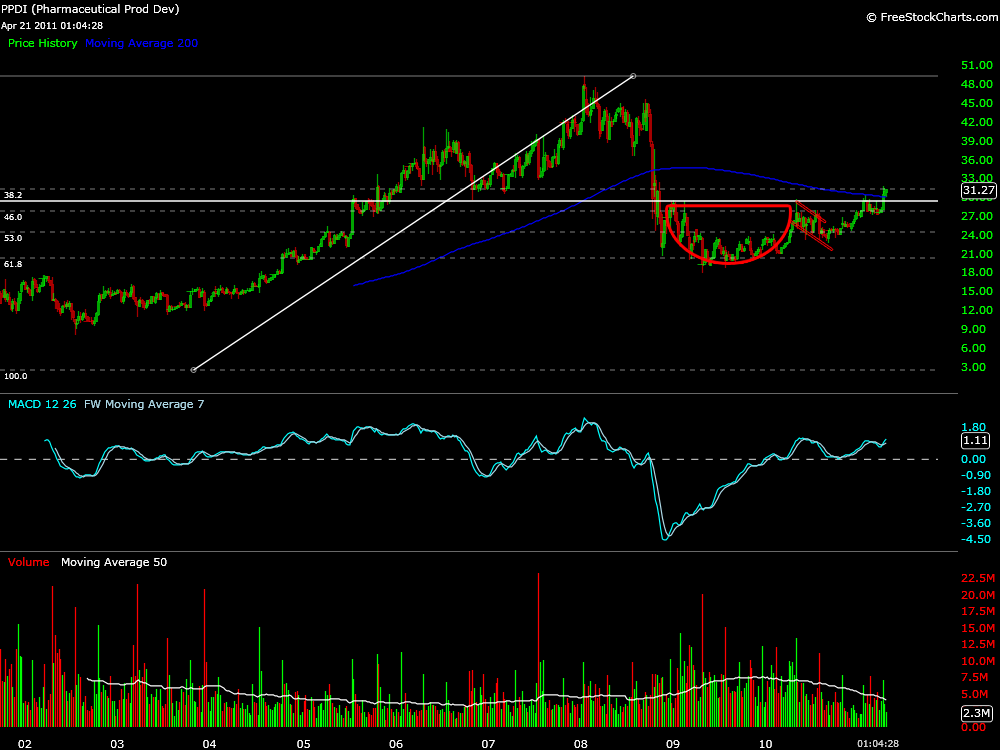
There is also a cup and handle pattern on the weekly chart, depending on how large you want to draw it, but looks like PPDI could be breaking out soon. Be aware that earnings are scheduled to come out on April 26 after hours.


