Id like to compare two charts of the ES_F from Monday’s trading 4/30/12. I trade small size in the ES_F and it is sometimes difficult to hold onto positions for long this way, there can be little to no scaling of profits outside of the gate prior to meeting projected targets. Having to trade small in the ES can/has lead to hindsight trading, as range days can turn to trend days, trend days can last “forever” and chop days chop you up. Hindsight bias diminishes your edge. There is no guarantee what happens today or in the last hour will repeat itself tomorrow or later in the day.
On Monday however, I noticed something that helped confirm my position and I wasn’t reaching for this confirmation as Ive done in the past (emotional data). I found that an indicator I had been experimenting with of late gave me real time visual confirmation of an already executed position.
Three things have so far risen to the top for me lately in the ES_F. Not in order of importance, but perhaps stages of assessment.
1. Opening range/Overnight high and low
2. Fibonacci
3. Fib EMA’s (just now)
I note that Monday was my Fib EMA epiphany and although it may be for this particular trade I have found watching this charting setup helpful in recent past. Its been pioneered and developed by @RagheeHorner at http://www.ragheehorner.com who mostly trades Forex. I have not subscribed to Raghee’s site and I can’t be completely sure I am using her set up correctly, but follow her tweets and analysis.
Another mention must go out to @TheFibDoctor who teaches the Fibonacci fade if you will. I have found Dave’s Fibs to be very powerful and he goes over them in relative detail on his site and throughout the day on StockTwits. I have the same experience with Dave as I do Raghee; currently Im using these theories under my own interpretations and have not yet subscribed to receive the exact mentoring that they offer.
The following attempts to diverge the emotional visual connection present using technical indicators, how I escaped this and was pleasantly surprised. Thesis being; The confluence of this third indicator to the trading equation (in this instance at least) was interpreted purely visually.
Many may find that nearly everything is visual in a non automated trading system. But its how those visualizations are digested that I’m interested in. From a risk reward standpoint my trades are placed based on statistical data, numbers and prices. Think of hard stops, price entry and exits yet the exactness that remains after execution can turn to emotional projections. Much less visual interpretations.
Although ridged indicators allow me to execute a trade, quickly my emotions will try to tell me if the trade is “working” or not. I don’t find this to be a bad thing in a trades infancy, however how you control this once your edge has produced a “winner” is the connection I experienced here.
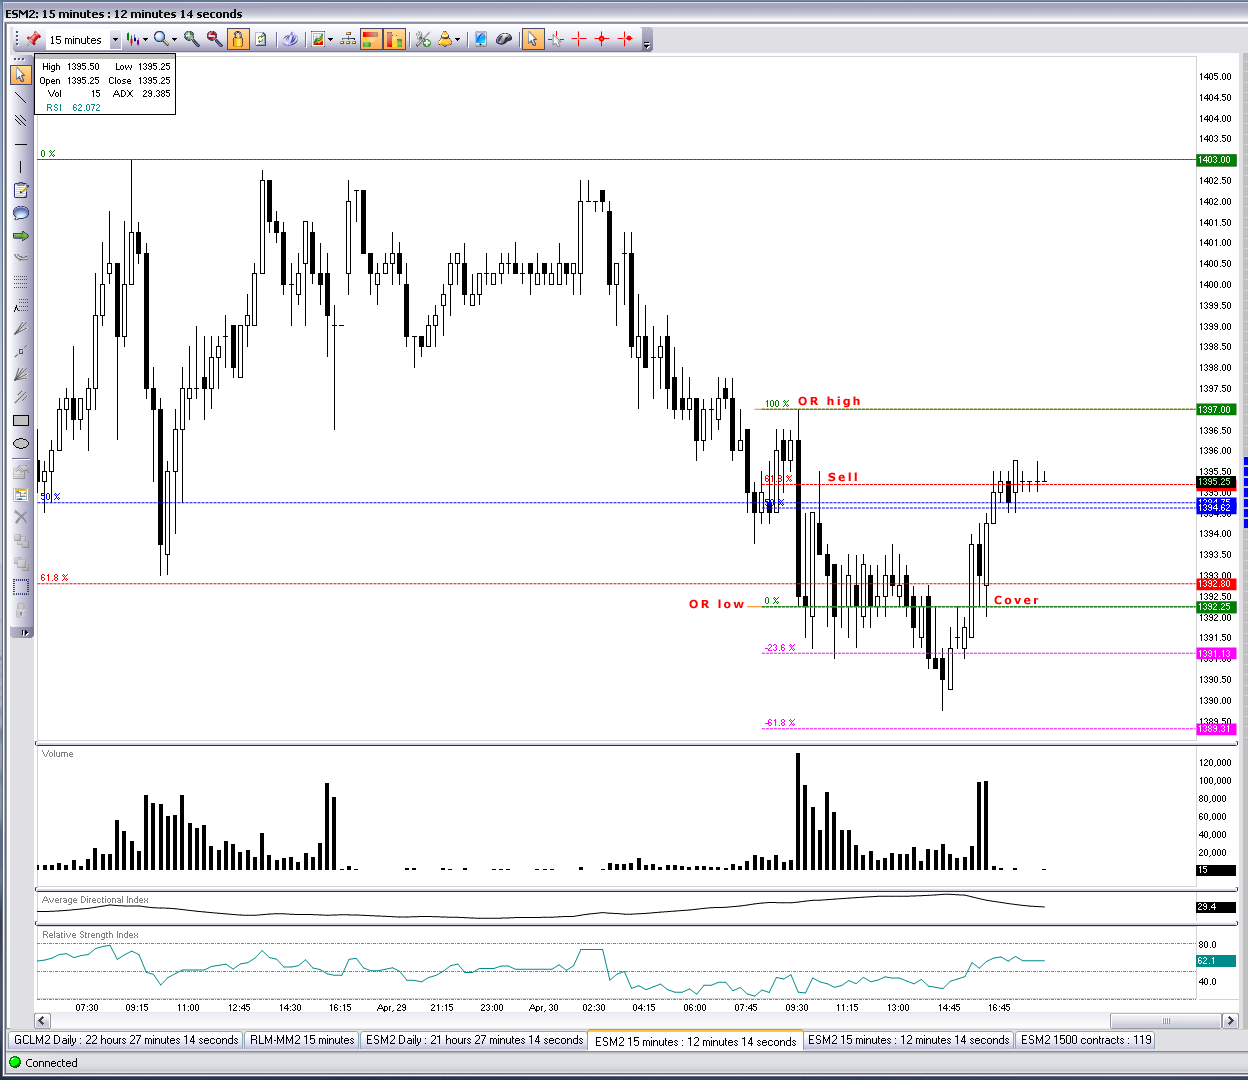
In this particular example, the opening swing in ES_F was sold quite aggressively and after probing the opening range (OR) -236 level and holding the OR low (10:00am set) I looked to sell a Fib retracement of the OR. There was also a correlation at a 50% Fib within the OR of a larger time frame.
After selling the 618 retracement (95) of the OR, shown in the chart below, the trade started “working” but after reaching prior lows traditional candlestick charts (the charts I placed the trade off of) began telling me there may be a play for a breakout higher and to cover the -236 extention.
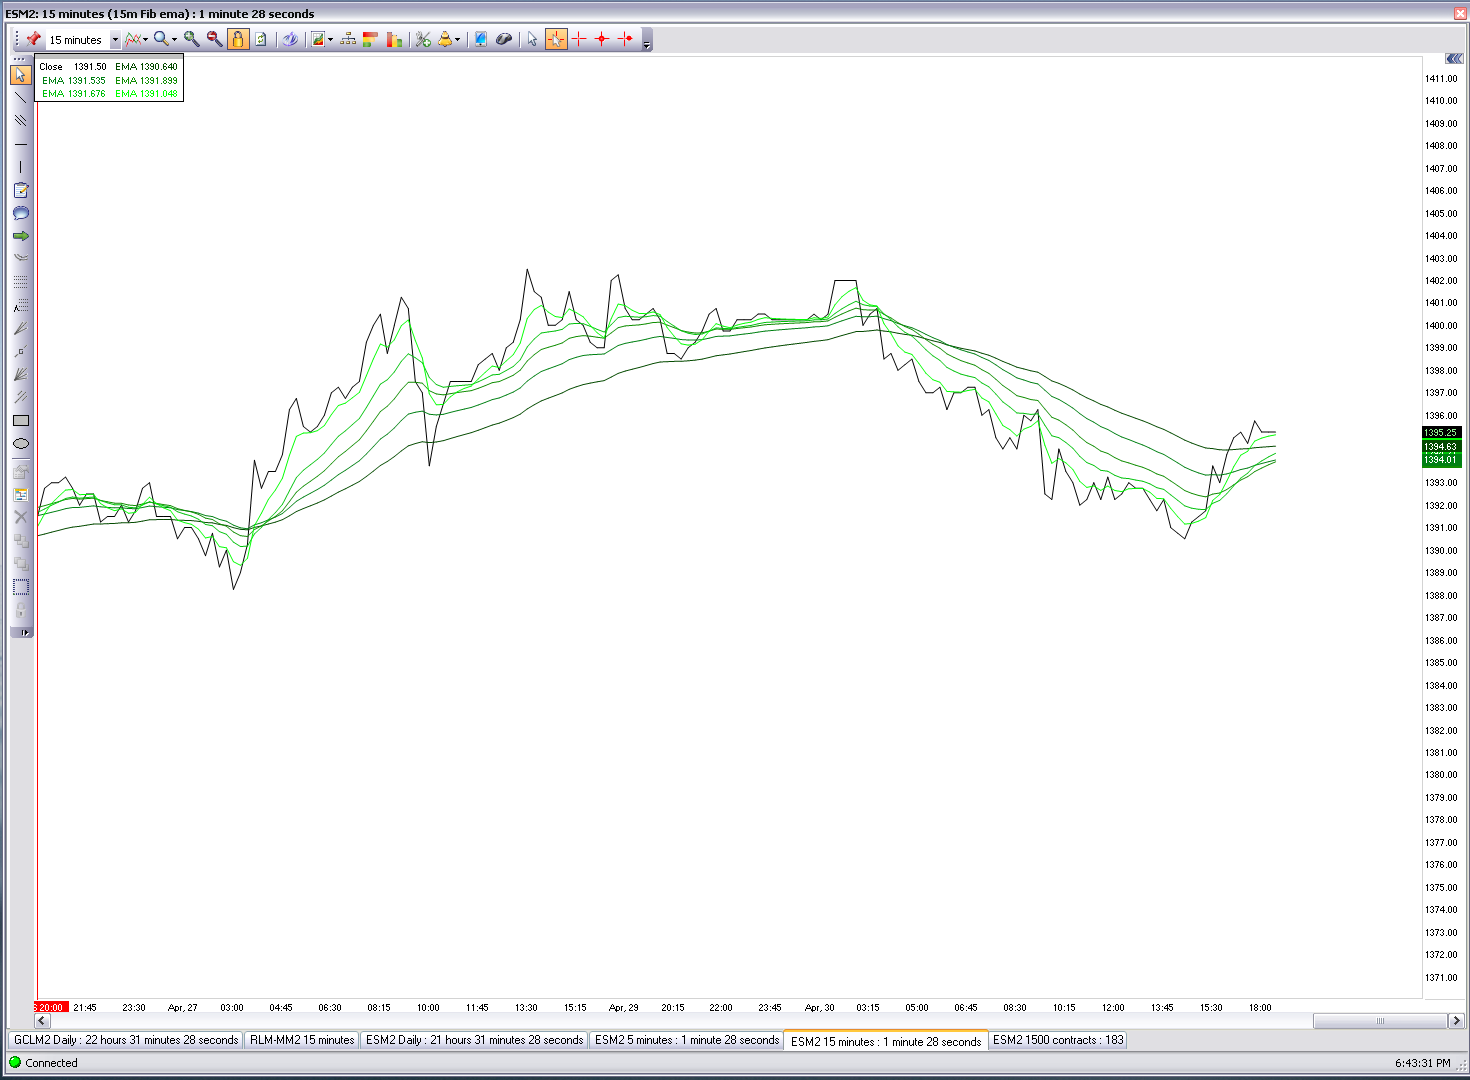
When I switched to a 15m Fib EMA chart I got a clearer picture with not so much price. Instead of watching price points and morphing patterns, all risk parameters aside for the moment, I was only watching the flow of Fib EMA closes.
For me, a visual confirmation of my trade setup after execution is the strongest emotional connection I want to have and can have with a trade. I need to embrace that occurrence. It not only allows me to disregard any hindsight bias I may have, but also not over think my trade and let the trade continue to work which is very difficult to do with small size.
Watching the Fib EMAs throughout the afternoon gave me reason, via visualization not emotion, that the breakdown was likely not finished despite sideways action on traditional candlestick charts.
When I say that I made this conclusion in a purely visual way what Im trying to differentiate is that I saw falling EMA’s and a falling closing price line and no emotional interpretation of that image was necessary. In essence, no change in the short term trend, surprisingly less chop and less opportunity to make a trade outside of my entry. So far I had an optimal trade entry.
Later in the day ES_F broke down past -236 extention and reached for the -618. This lead to a sharp rally which is shown in both charts.
Breaking above the OR queued the possibility of a reversal. Not only was a close above the OR low held it was tested quite thoroughly. Not much opportunity was allowed for a cover below this point again and it was a signal that you could no longer safely be short and the OR range chop was back in play (covered 92.50).
So what is more important…feeling in control and managing a trade correctly, or hitting ones target?
Exercising my thoughts on this trade set up may only lead to minor gains in p/l, but it makes example a technique that eked out more “edge” in a market that can have little conviction for continuation past relative extremes intraday and isolated emotion from a trade when it was no longer needed. Knowing that one more push is coming, or that a move may not be complete can save you going either direction.
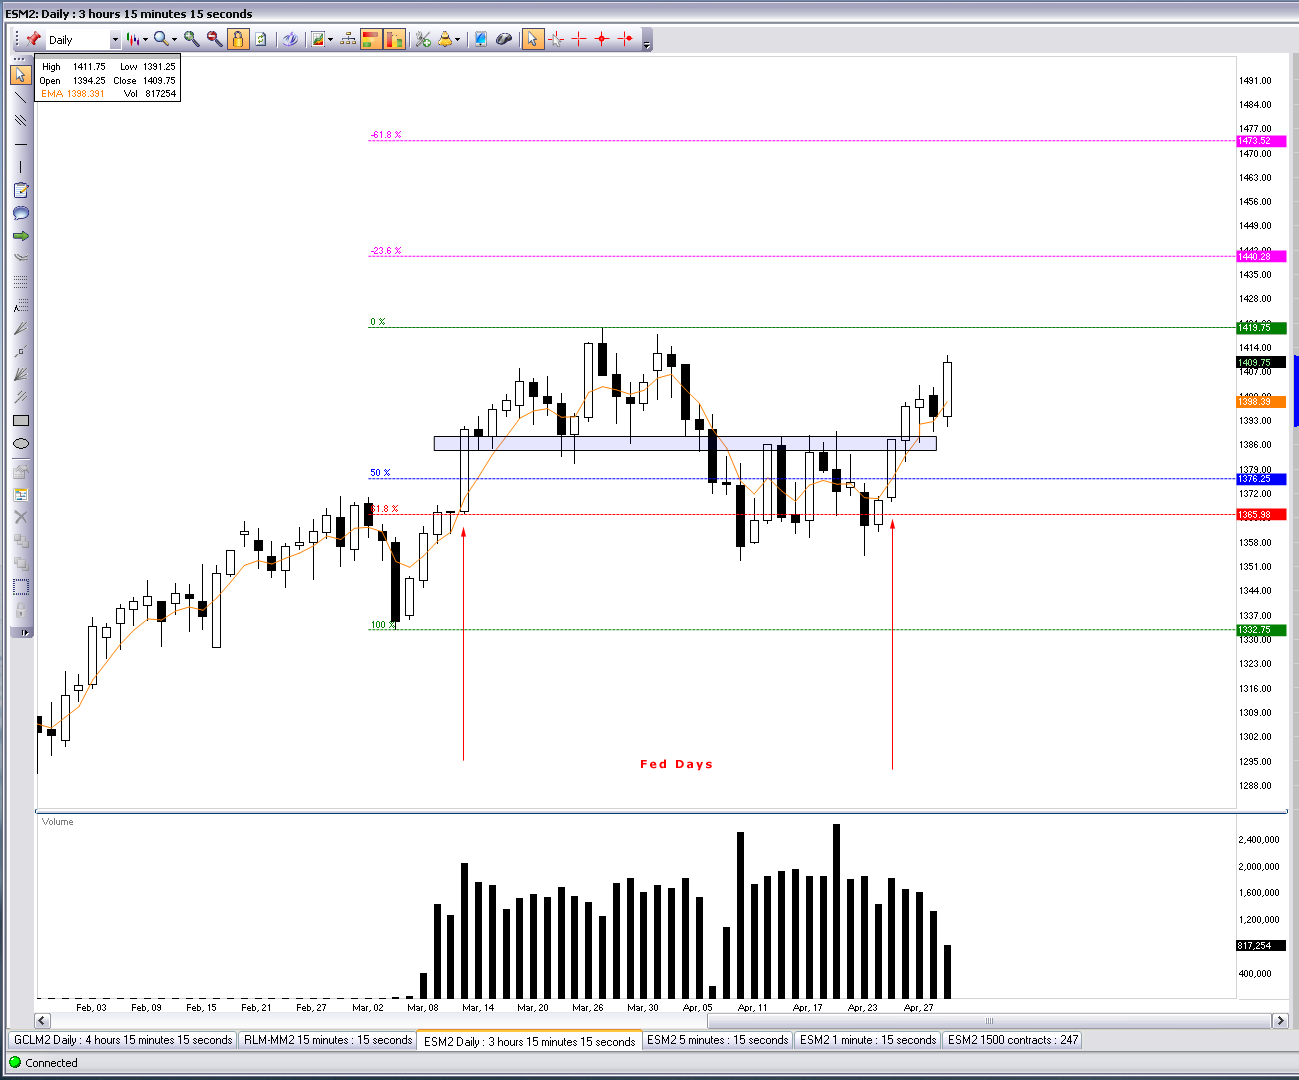
My target was aggressive to the downside at 87 which was beyond the -618 that wasn’t reached and would have led to a double bottom of the prior move higher as well as a second test of the Fed day range now acting as support. The daily chart below is shown to suggest the importance of this level since 4/25/12 Fed day.
As Im set to post this the ES_F has rallied through its opening range Tuesday May 1, 2012 and has now traded to a high of 1407 on the back of a favorable ISM number, 1406.89 a -236 Fib extension from 4/27/12 low/high range and prior resistance.


