Todays trading the ES_F was a roller coster. Although I was expecting the bias to be to the upside, I was not expecting a large magnitude move through the OR. The price action was tipped off by the ISM data that came in at 10 a.m. EST and the morning action was difficult to plan a trade around.
I wanted to note something in hindsight today as I did not place any trades. Despite the large move higher in the ES_F off the news (20.5 pts off the days lows) there was opportunity to make close to 10 pts on the downside by just being patiently observant.
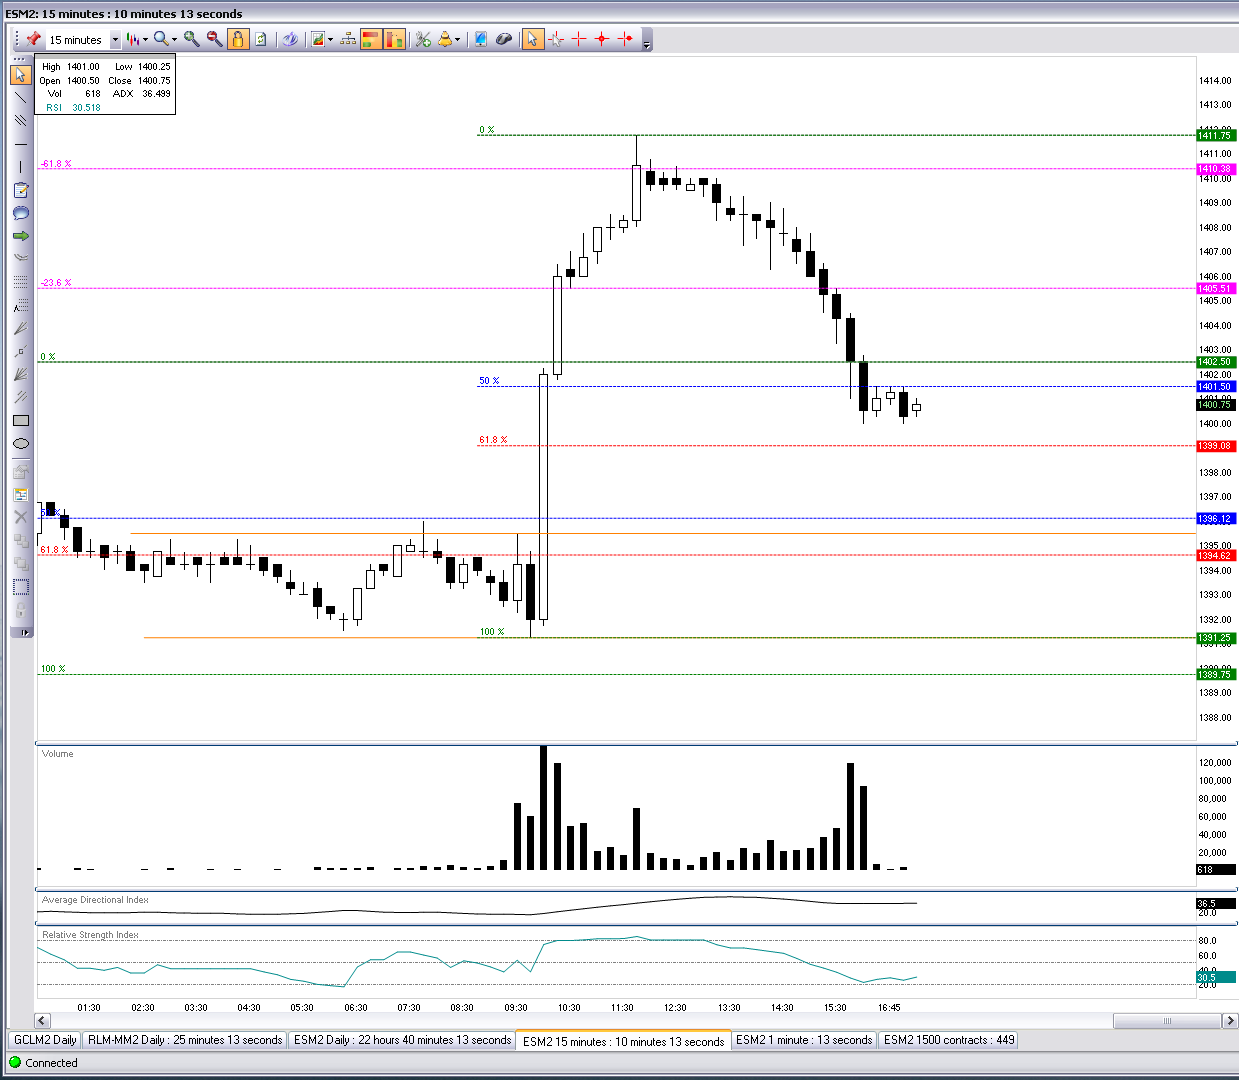
The first chart below is 15 min and shows the opening range (OR) in orange. The break above the OR could only have been caught with a limit buy order above the range or by watching the 1min chart which paused briefly at 97. This made for difficult risk reward strategy to the upside and frantic covering for shorts.
In the chart above, the larger Fibonacci extensions to the left of the days trading are measured from the prior days high and low (green) Monday 4/30/12. It can be seen that some pause was given at the -236 but not the reaction one would like to see fading that level, in fact this level acted as first support. After this is seen it becomes very dangerous to fade a move higher.
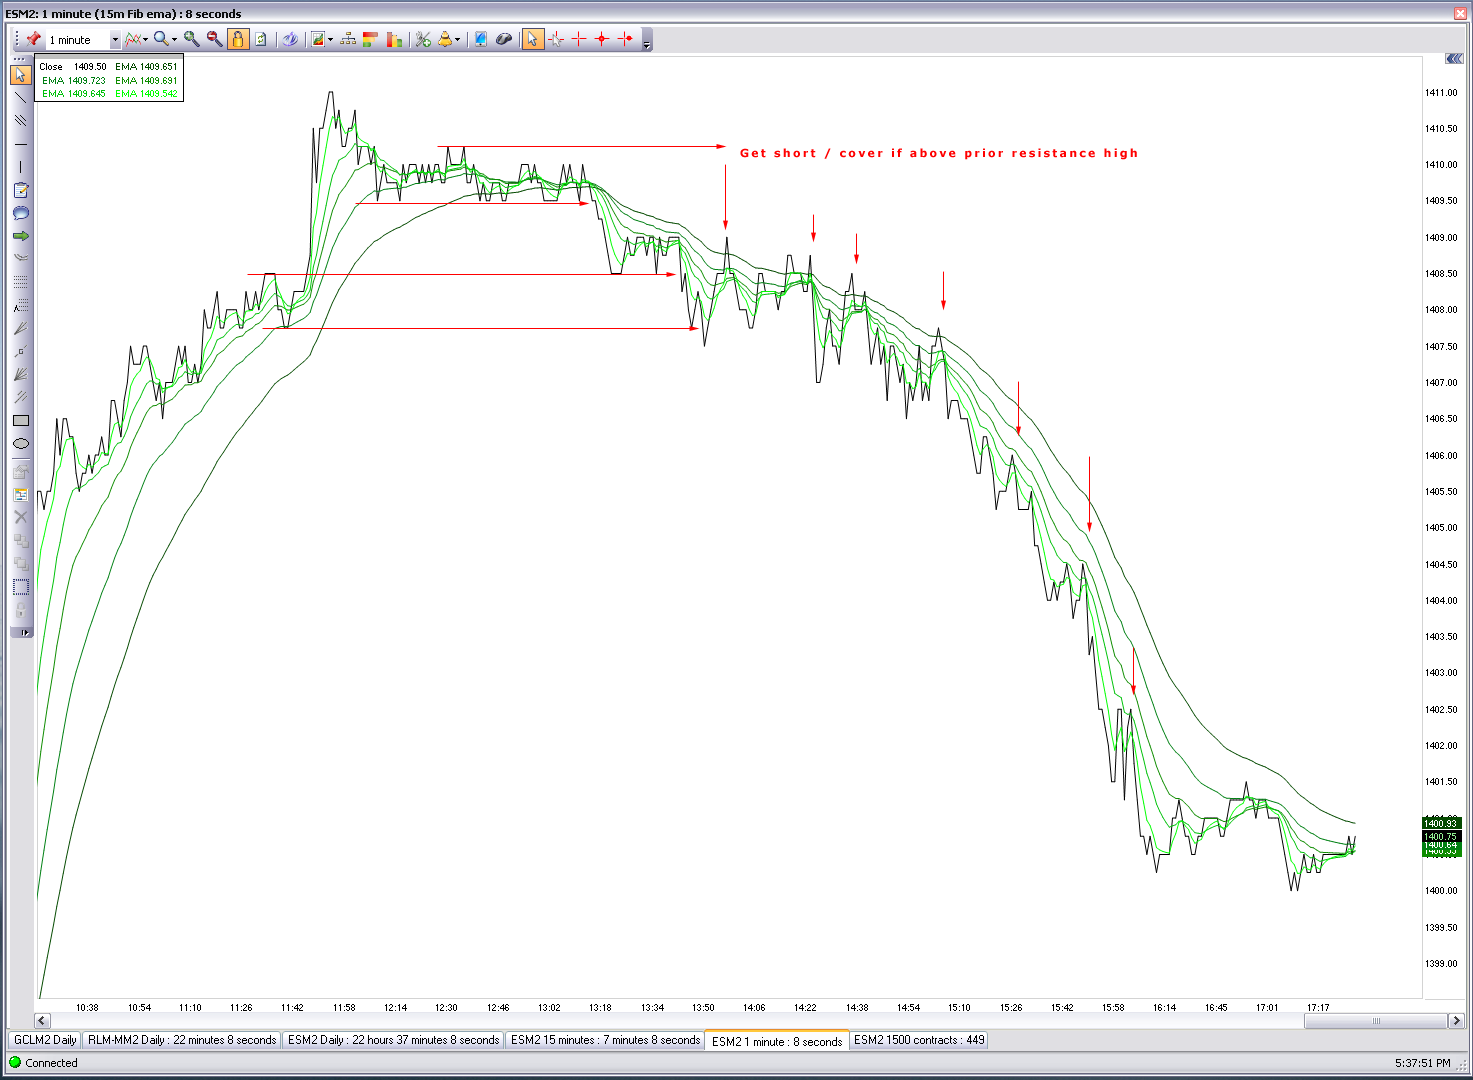
The -618 level held prices in check for most of the early afternoon. At that point I started watching the 1min Fib EMA line chart. This chart showed no significant sign of weakness all afternoon, but then gave a simple signal that many probably ignored as lunch time/afternoon lull.
In this case, in hindsight, it was a signal that could have repeatedly been played for profits to the downside.
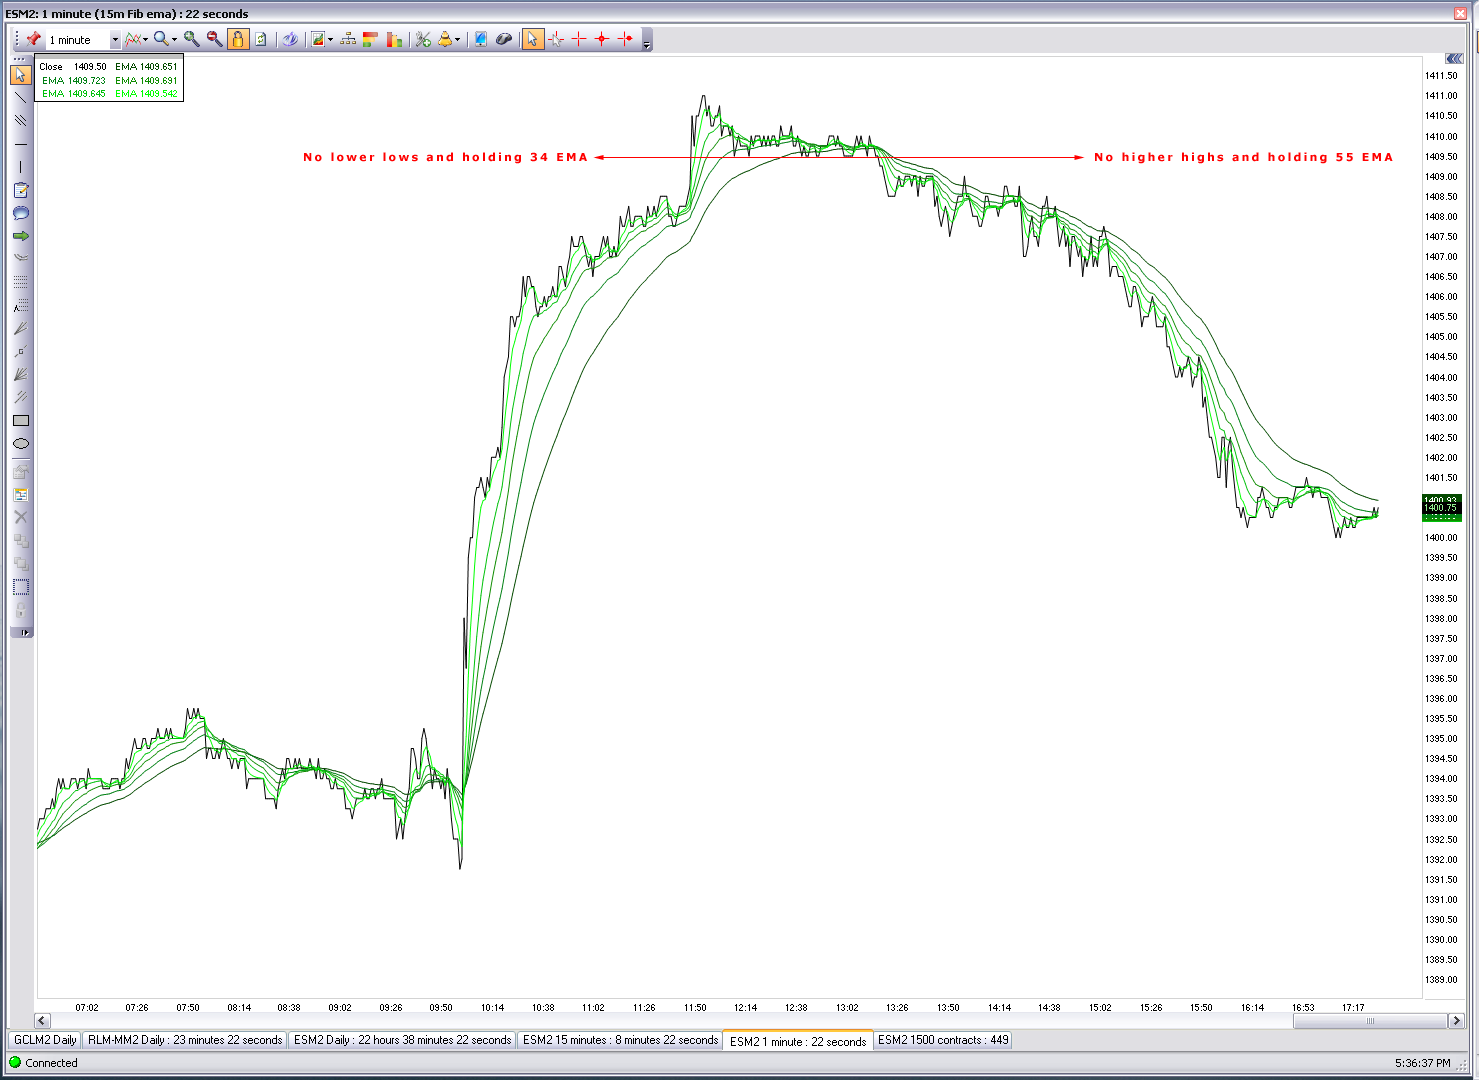
Below the 1min shows that depending on how aggressive you wanted to be, after significant sideways action occurred at the -618 any one of the lower lows could have been shorted at resistance. A lower low was made all afternoon with simple resistance at the 55 EMA closing on the lows.
It was very interesting to see this type of move hold for so long on such a short time frame. And in fact it actually held true to the upside off the lows as well. Price action seemed to be quite organized despite the appearance of an outsized and volatile move.
I will remind people that I do not see these types of moves as being volatile. By definition I see them as large magnitude moves and in fact hold little volatility or price detail relative to time frame, FYI.
Currently the ES_F has retraced more than 50% of its move, shown by the FIbs internal of the days range in the candlestick chart above, and is finding this level as resistance in the globex session.


