I just want to post some chart comments on GLD. Its hard to not let our thoughts get away from us when we look for major turning points, but there have been a few out there much smarter than me with macro viewpoints bearish on gold lately. I love hearing some of the possible scenario fit into my thoughts and so this is an exercise of those thoughts. I’ve said dumber things before and yet nothing in quite a while…
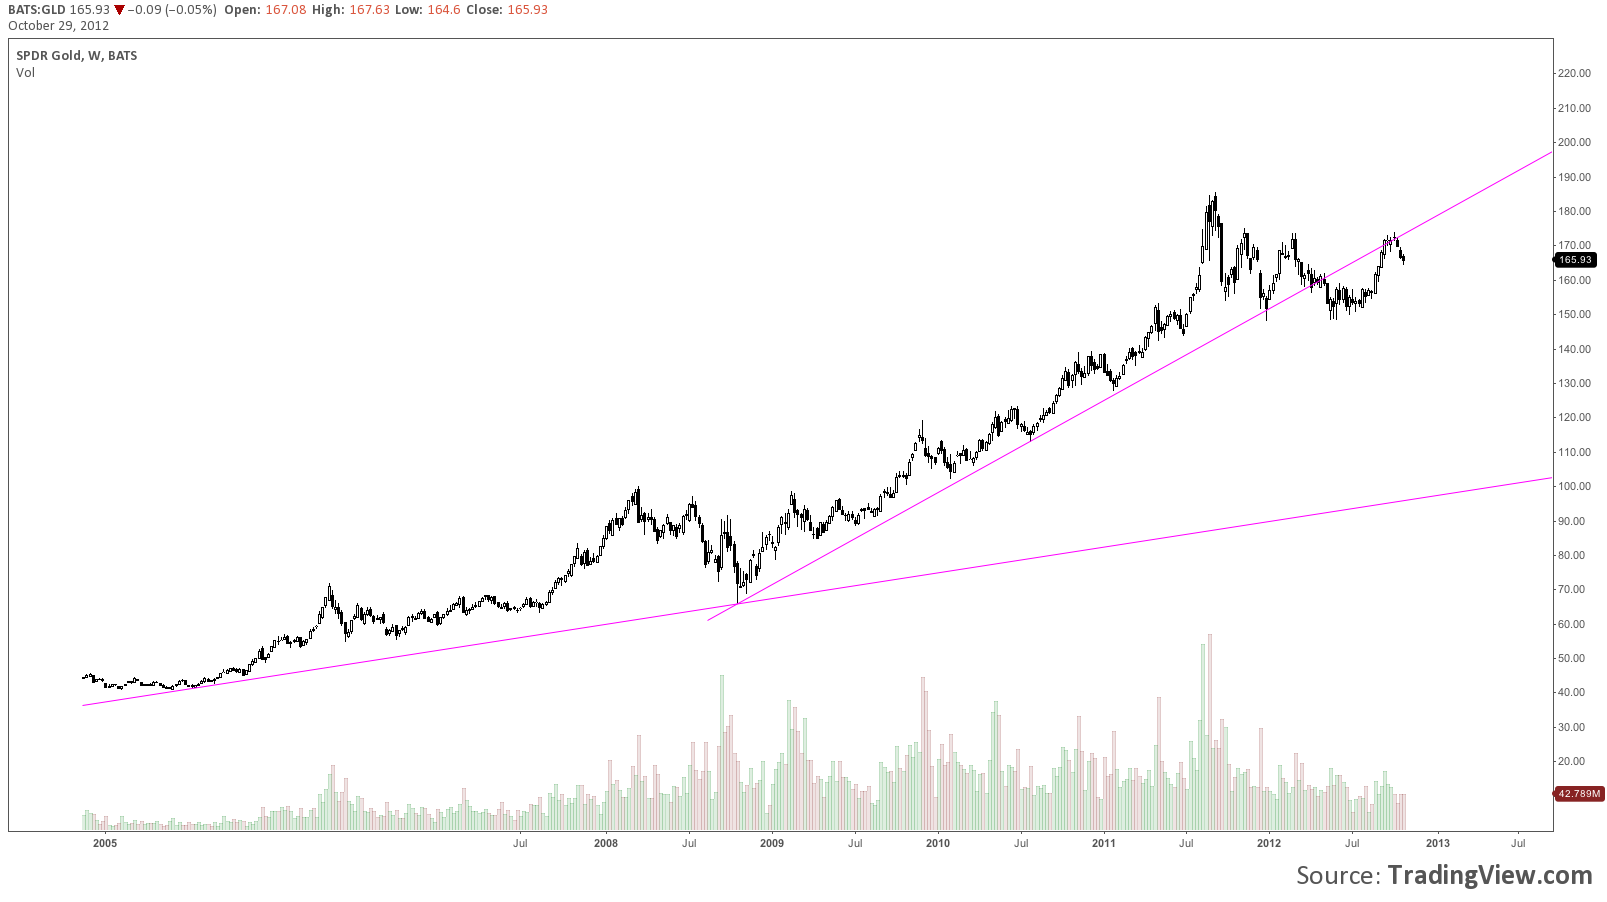
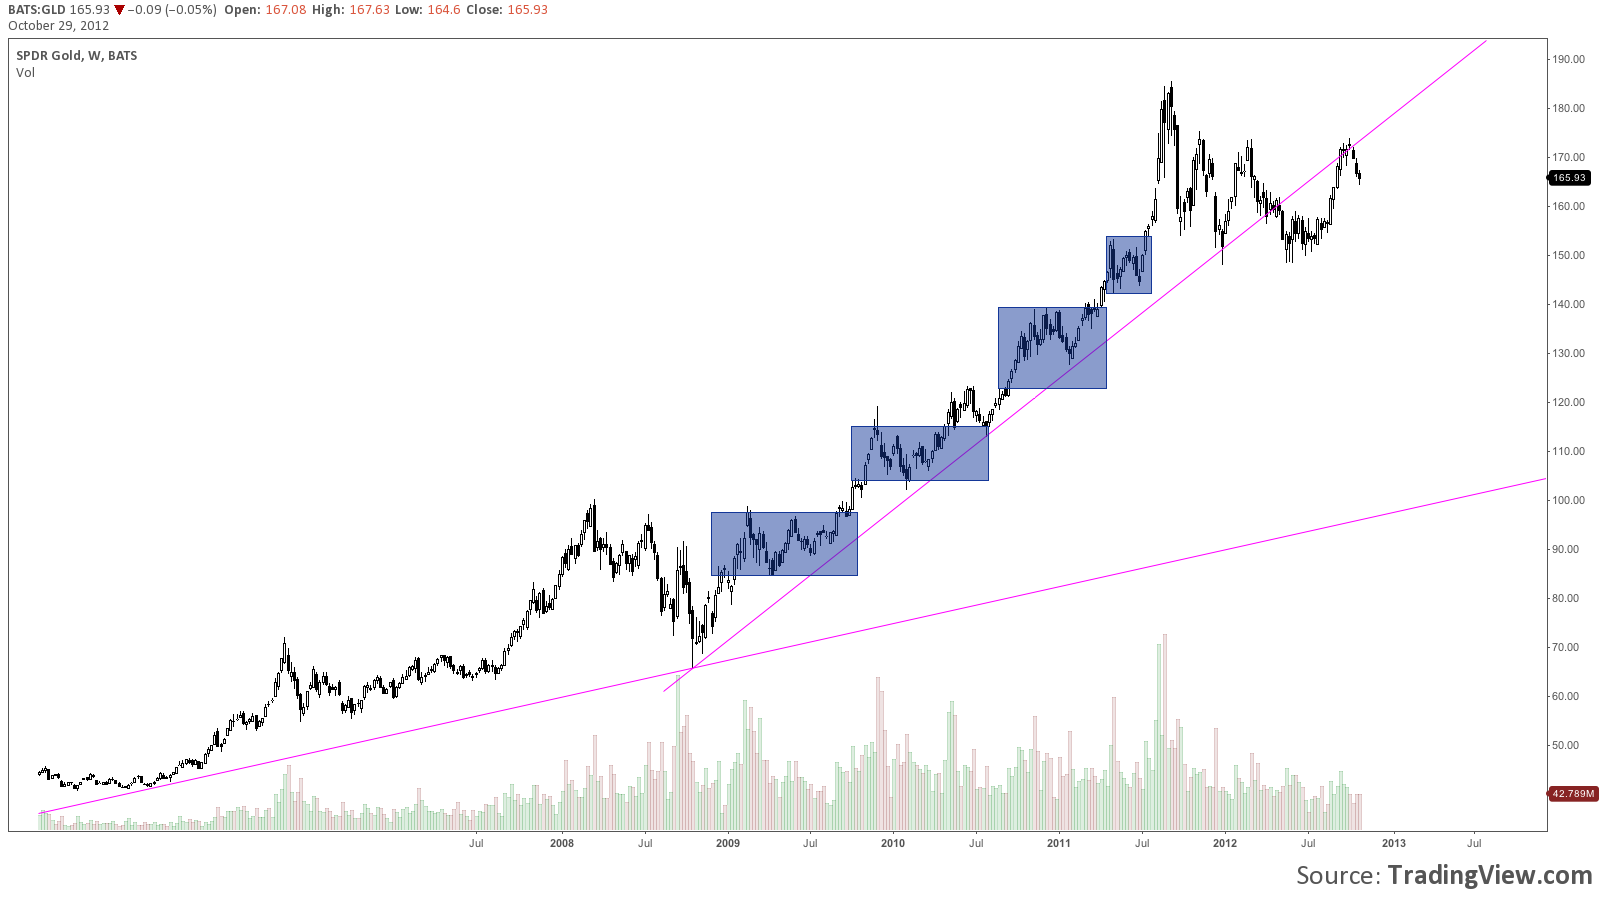
Linearity v.s. consolidation. Where does one trump the other? We love following huge macro mega trends with straight unending price lines, but what fuels these linear projections can also taketh away.
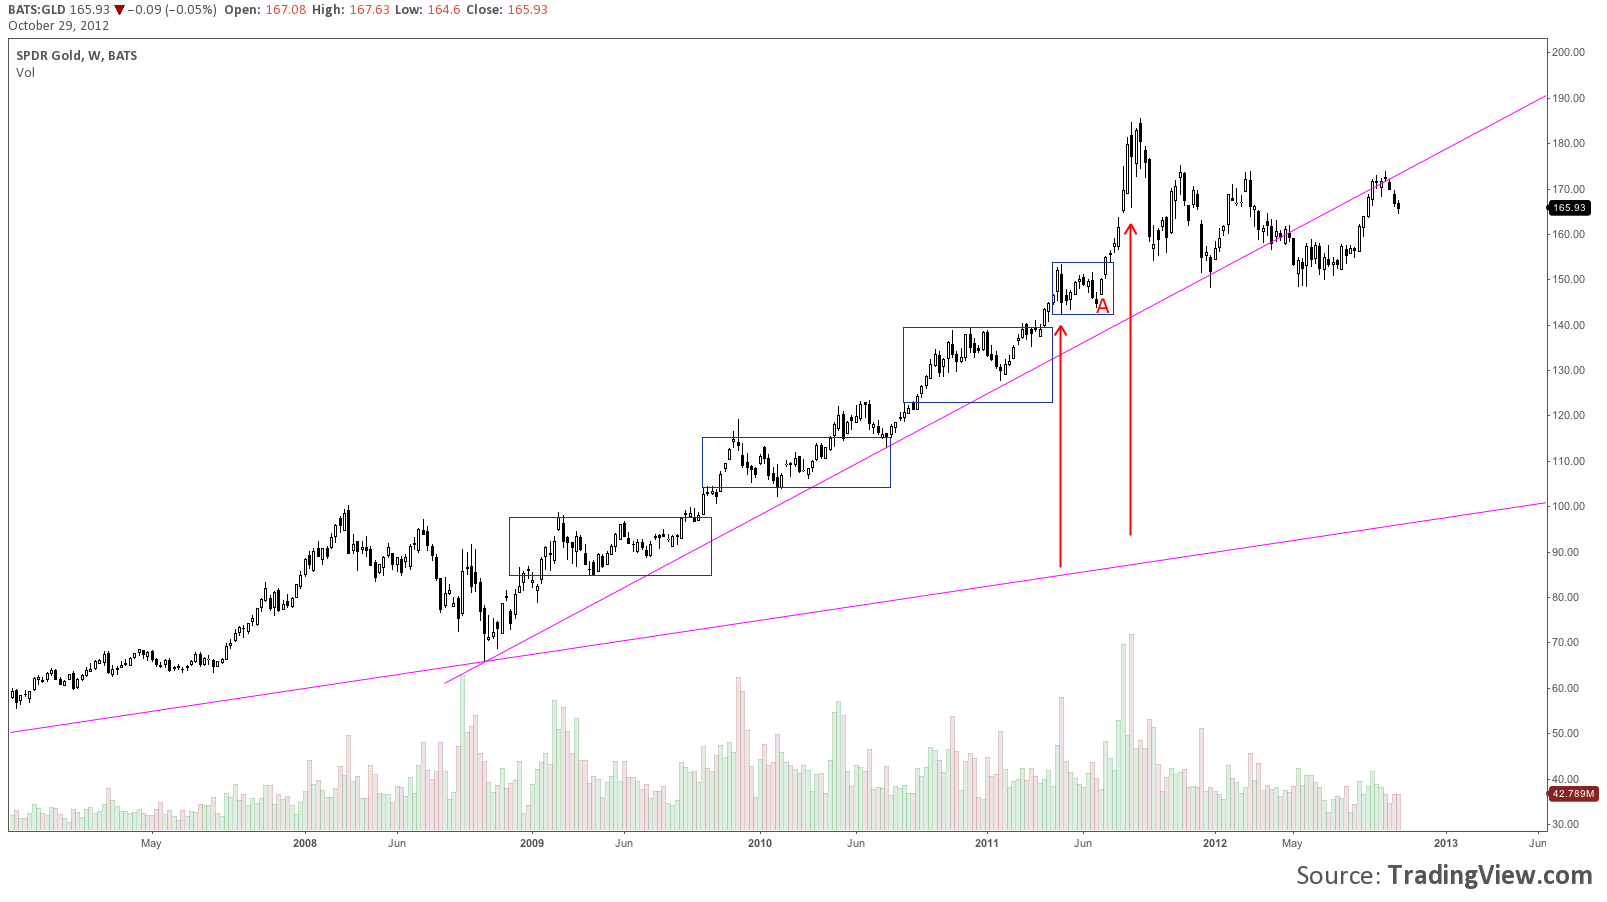
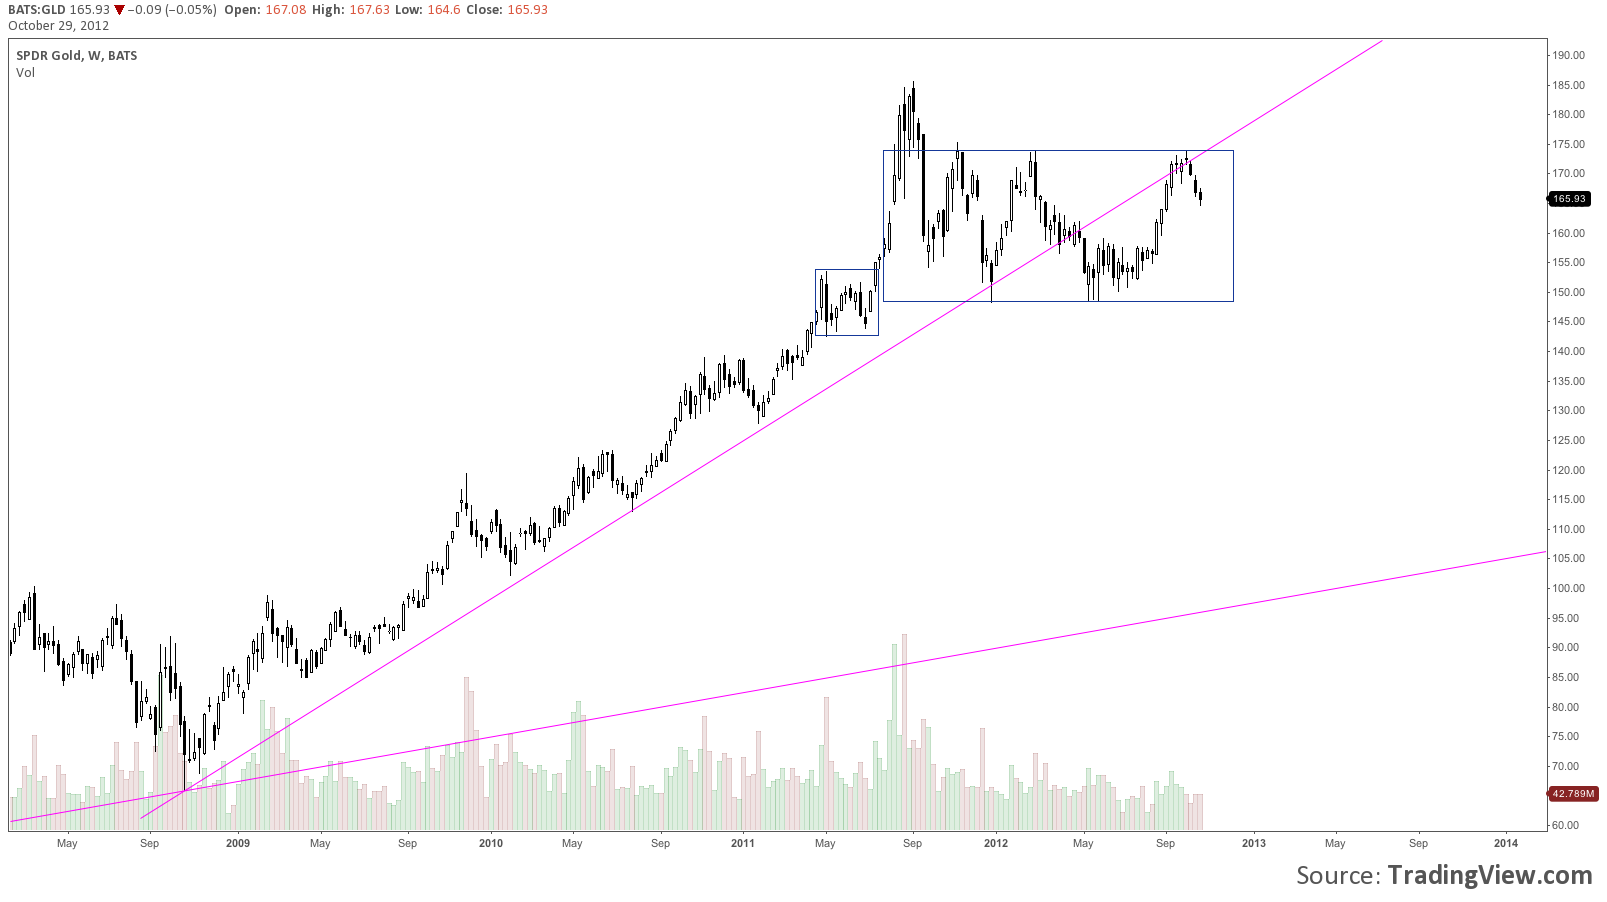
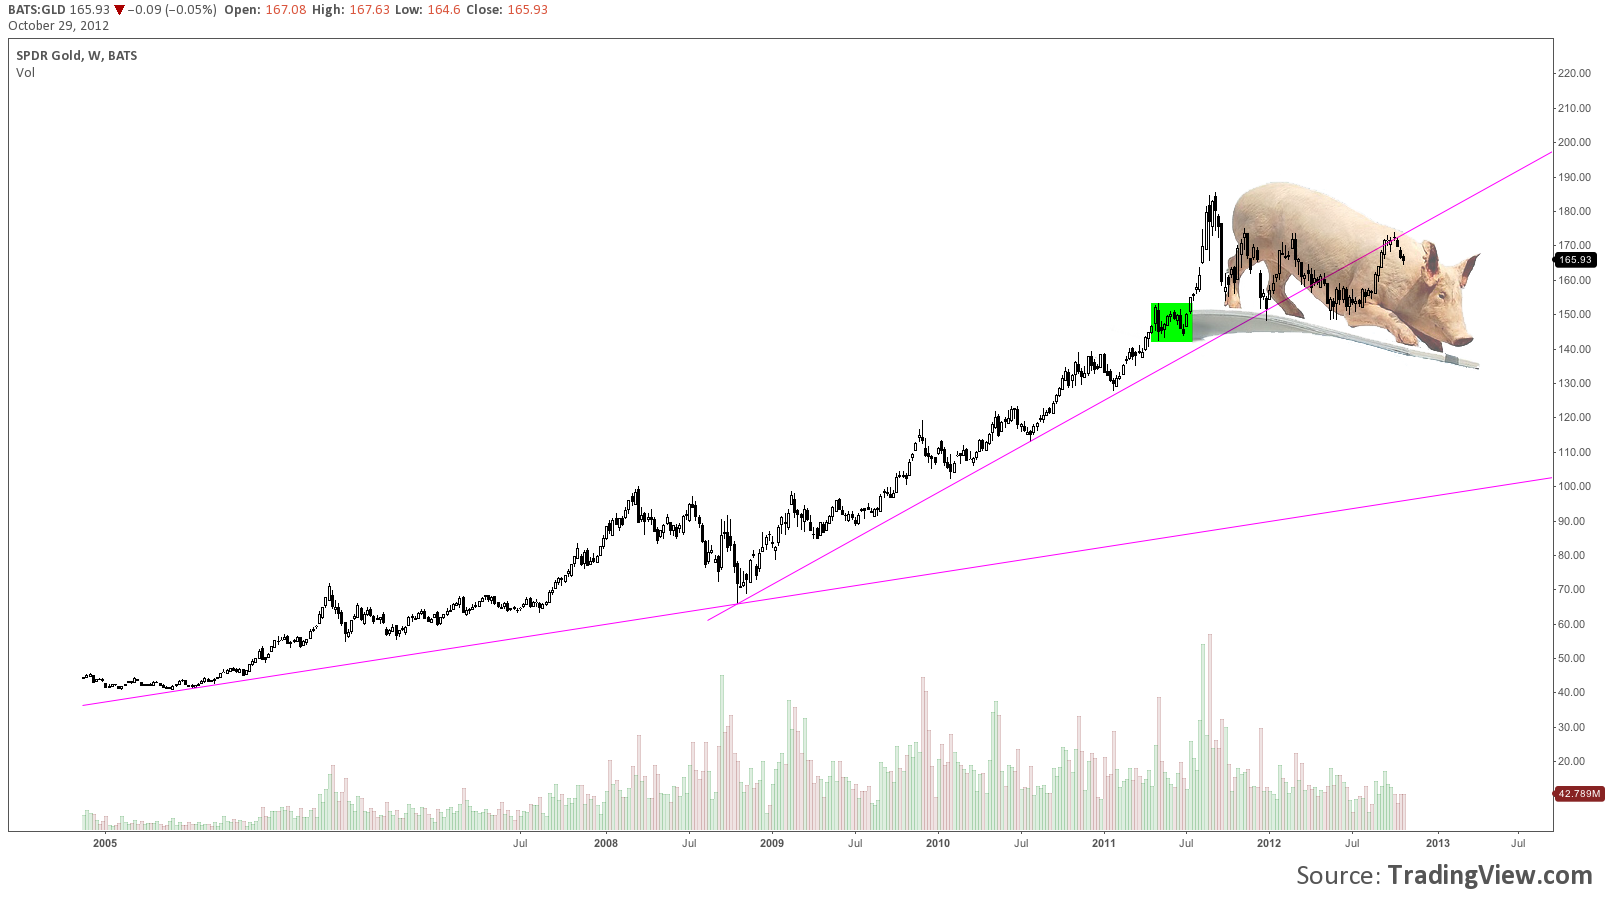
Prior consolidations from the start of the trend line (late Oct 2008) were much larger. The abruptness of the narrowed consolidation leading to the sharp blow off in late Aug 2011 is followed by very large selling volume.
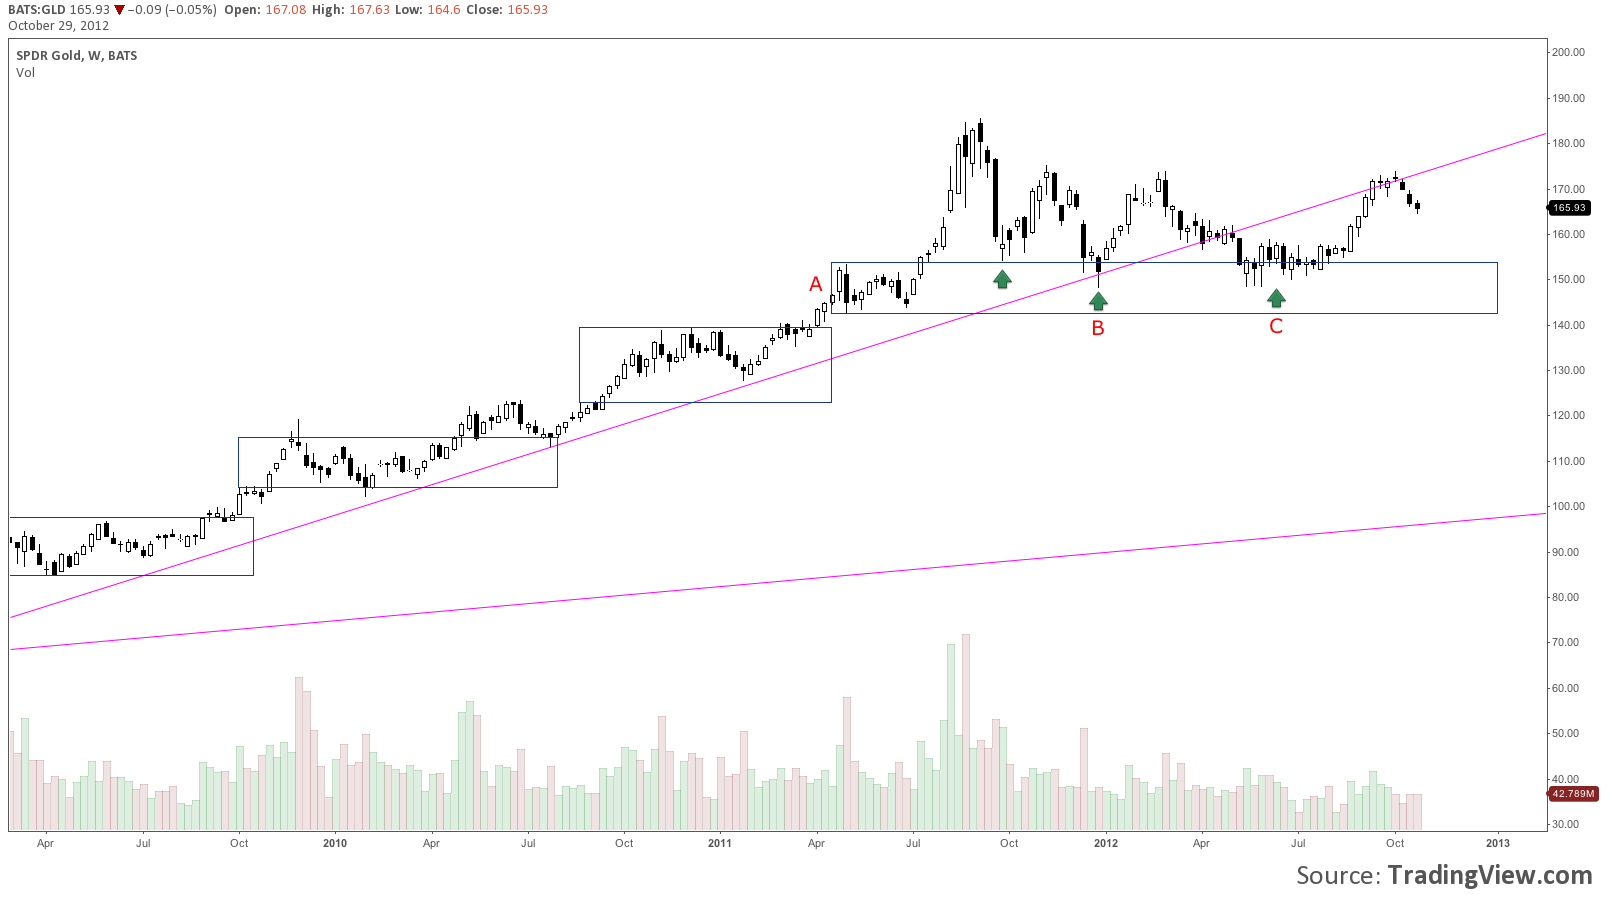
I find this small consolidation area, also a large volume area, in the GLD chart labeled “A” important. It appears to be the last bullish consolidation before the latest weekly uptrend line was broken.
GLD has shown support at the level “A” during pullbacks from its highs, but has not made higher highs. Should so much importance be placed upon this small consolidation area? I would say after such a long run, no. However I don’t want to ignore price.
GLD has run higher from this zone on three major occasions labeled with green arrows, the last of which acted as a coil to a sharp move higher.
The most important test of consolidation level “A” was the one which tested the weekly trend line perfectly labeled “B”. It was here that the bulls showed they were in complete control.
I would like to note the price action between B and C reminds me of the ES_F and how a perfect test of the trend line was made but then quickly relinquished as happenstance upon revisiting without new highs made.
I do not want to ignore the break of this multi year trend line in GLD especially as ES_F is telling us not to.
When hindsight becomes 20/20 maybe all I will have pointed out was GLD in a large channel consolidation.
But that is not fun to write about or to “think big” about and I want to focus on the tipping point.
The contrarian in me thinks that there is resistance forming at the recent highs in GLD that will become too heavy for the psyche of the small consolidation area “A” since the weekly trend line has broken and large selling volume came in at highs.
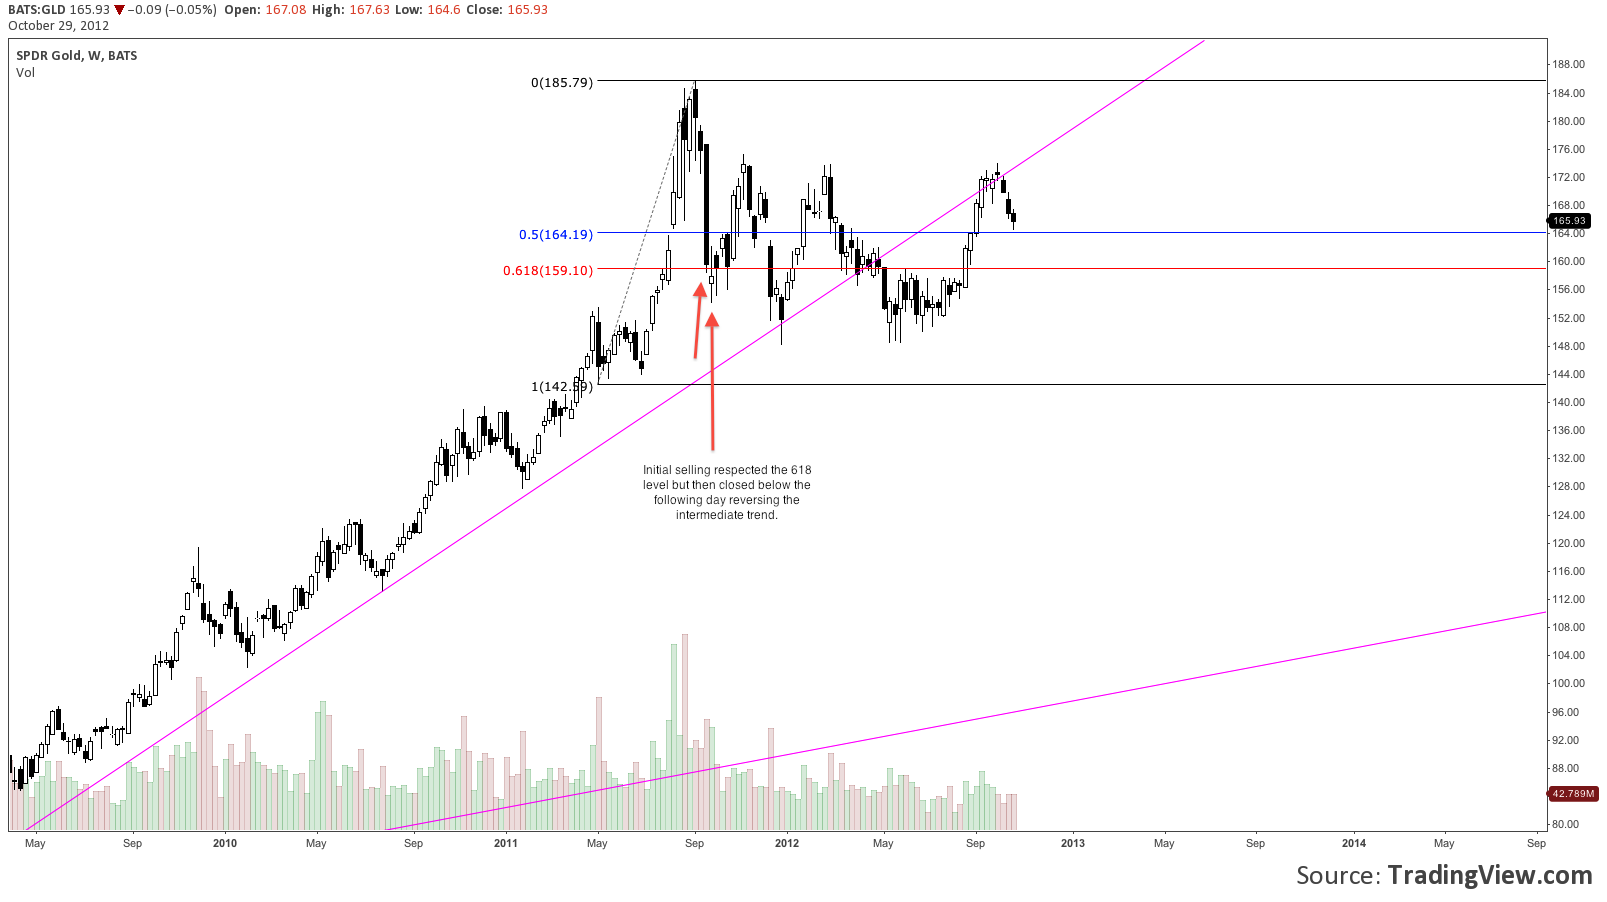
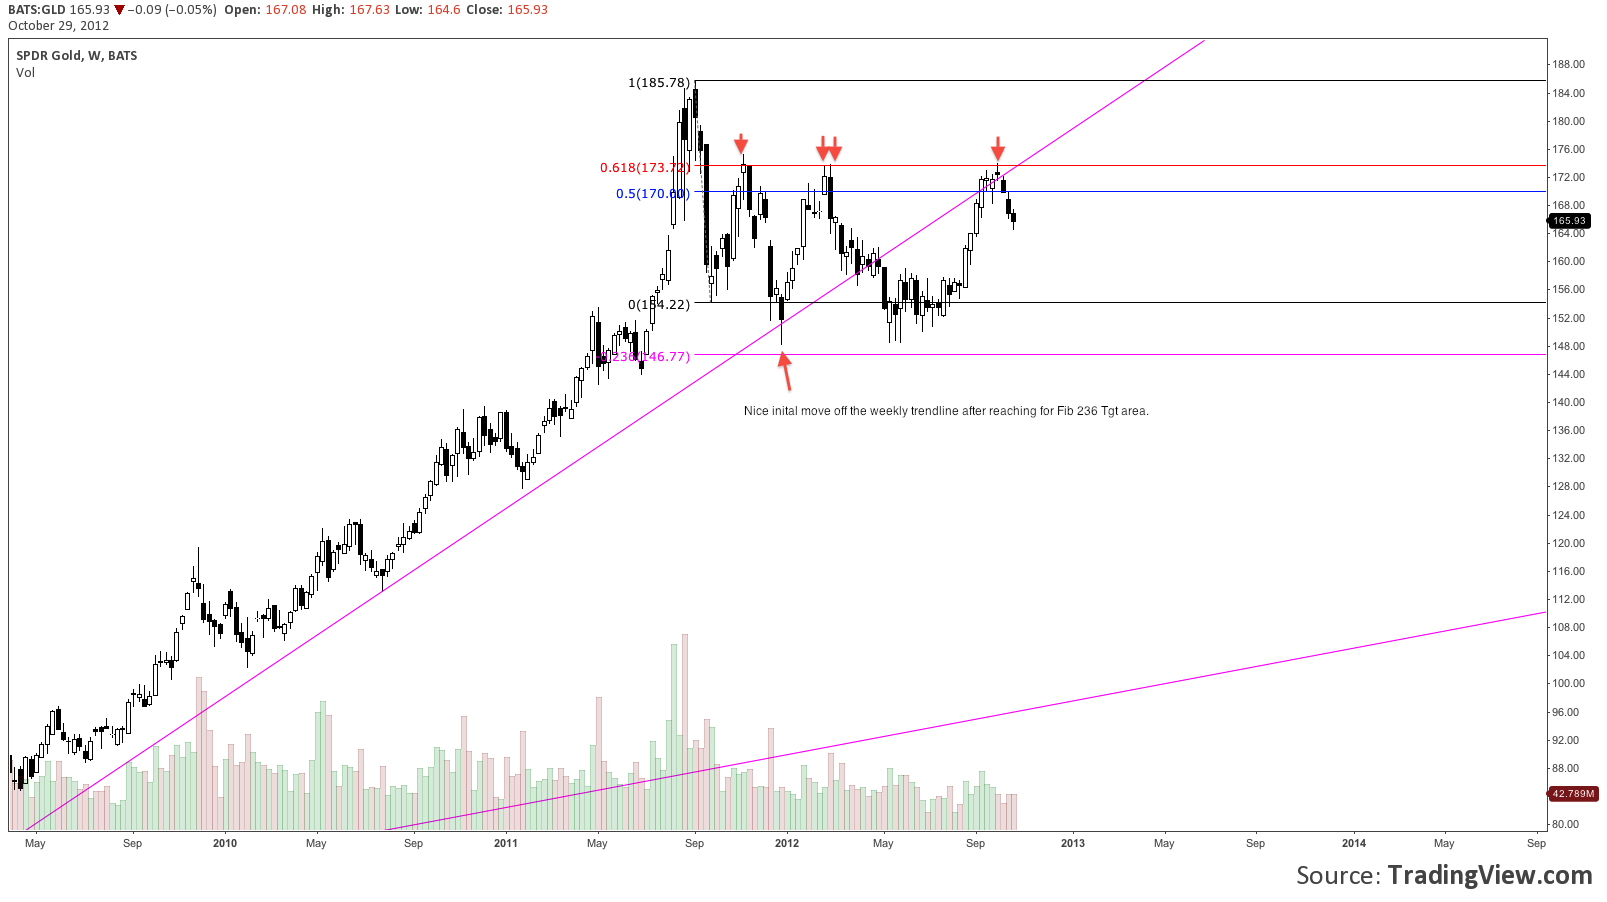
For these reasons I want to draw Fibs from point “A” lows to the highs. This first Fib draw shows that strong selling initially respected the 618 but then closed below the following day.
A close below the 618 denotes continuation of the intermediate trend and weakness. A new Fib is drawn from the highs to this candles lows after a close below the 618.
This new draw shows that the 618 level acted as intended, as resistance higher. Upon which a lower low was made reaching towards the 236 Fib tgt level. Then found a bounce off the weekly trend line.
I’ll restate that at this point in the price motion the bulls should have every intent and purpose to push price higher above the 618 level and reverse the intermediate trend with support off the weekly trend line.
We see that despite the nice move off the trend line price was rejected twice at the 618 level on consecutive days (tweezer top like) which leads to no bounce at the weekly trend line and a monotonous probing of level “A” support.
The subsequent coil that ensued at point “C” broke every triangle resistance line drawn and had the vigor of a major move as it ran higher.
But I argue that after the weekly trend line was broken the larger consolidation range has dominance and this price range has since not only rejected the 618 Fib a fourth time with precision, but also failed to regain the broken weekly trend line (kiss of death).
So far, this shows continued lack of commitment to push prices above lengthy consolidation zone highs and in a contrarians mind adds more weight to the level “A” consolidation tipping point.
The bulls are walking out towards the end of the diving board looking for a bounce. However, there may be a pig at its end.

