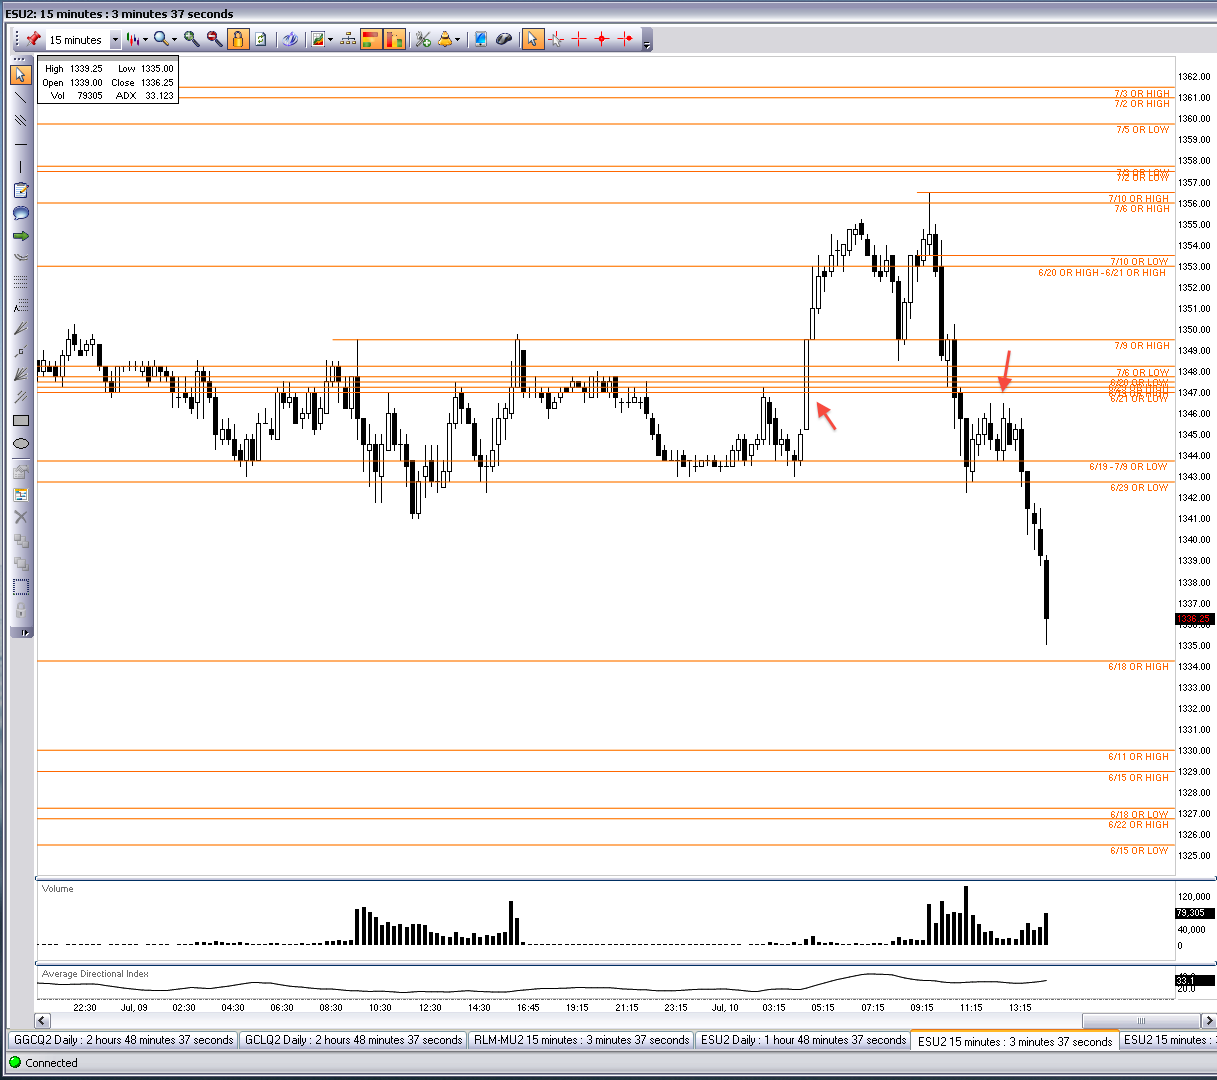
I put together an OR (opening range) chart last night while I was reviewing the ES_F price action. The OR can sometimes be a short lived “read” and other times it can mark the start of something bigger. I believe waiting for the OR to develop is an important part of creating my trading thesis currently relative to timing a trade.
I haven’t posted a lot lately, but have been tweeting a fair amount about $GC_F and the $ES. Im not looking to make any calls here just collect some of the thoughts shared and bring myself up to date in recorded fashion.
Marking OR can clutter up a chart quick, and I had not kept these lines up for more than a week in the past. With the last contract rollover for the ES I decided to set up a new chart with only OR on it. What I began to notice, of course, was the overlap.
Id like to review briefly.
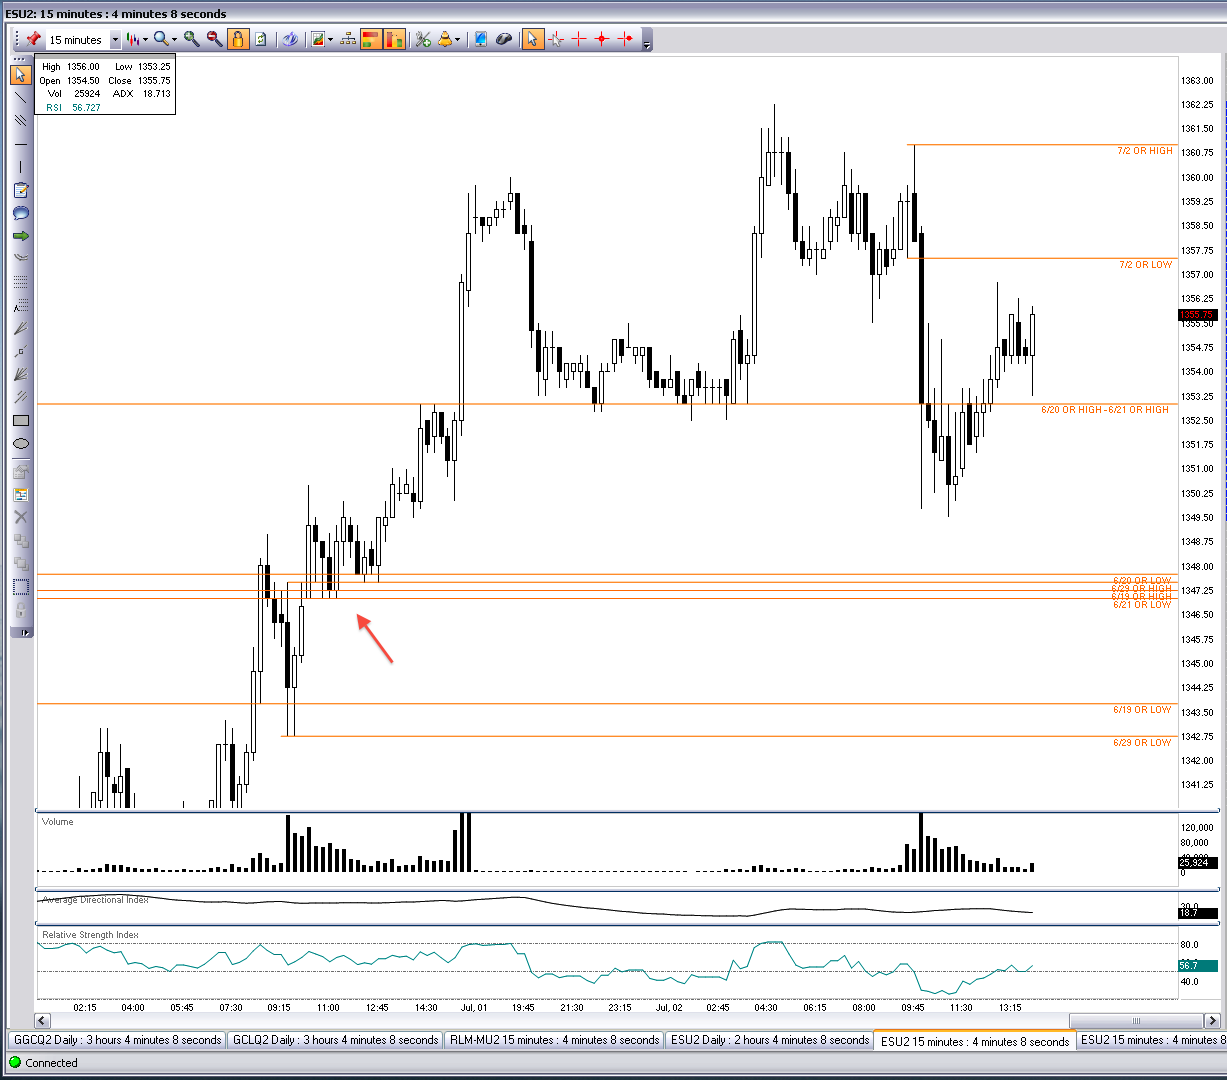
I made recent note of this overlap on July 2 with the following chart below now annotated.
The cluster of OR was penetrated by the June 29th rally and then acted as immediate support to that move.
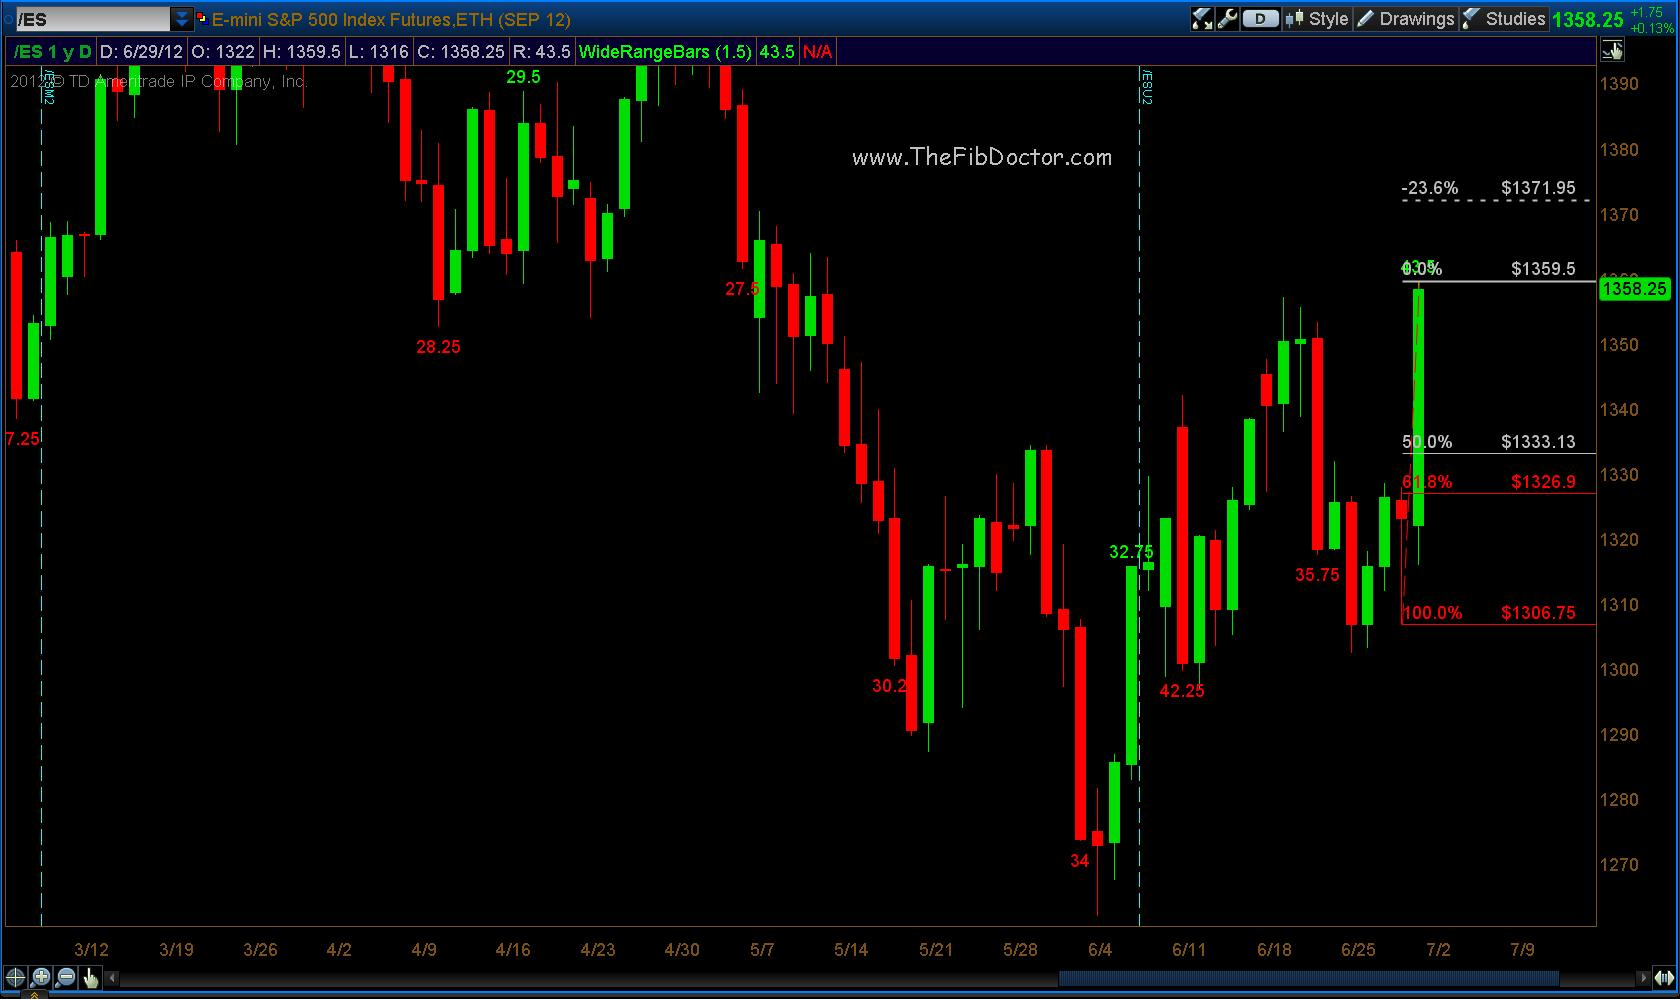
Soon after this support was noted a daily Fibonacci target was met at 1371.25. The chart below is from @TheFibDoctor.
These Fibonacci targets, especially the daily swing points, can be very powerful and its important to look for opportunities at these price levels. Learning more about these Fibonacci swing points has been my recent focus.
Also I have been watching the smaller time frames at these points of significance- relative to the Fib swings. Specifically the 5 EMAs.
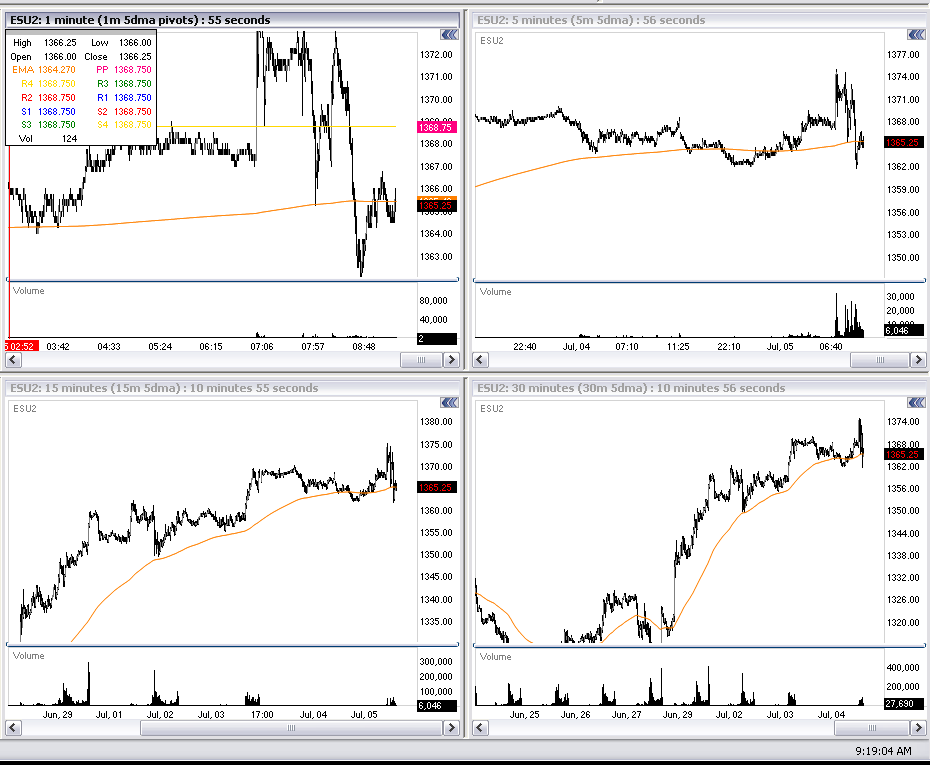
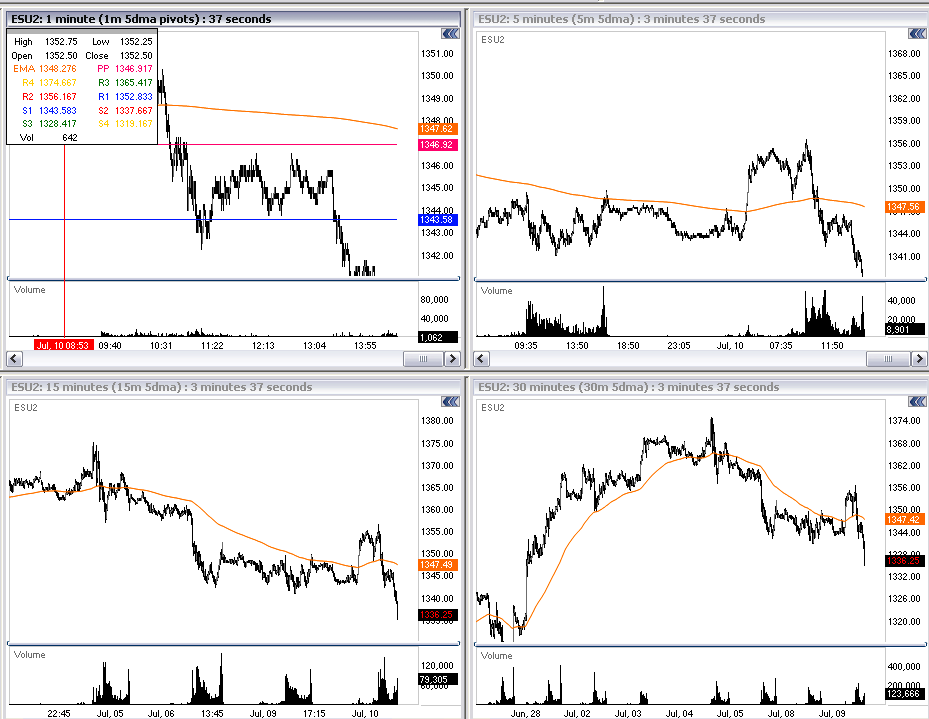
I posted the chart below which showed how ON (over night) selling had broke the 5EMA shown on multiple time frames, this can be another indicator to help conviction of the Fibonacci levels. Using the 5 day EMA is a practice garnered from @alphatrends.
I made note that price seemed to be “levitating” below the daily swing “fade” rather than above it. Many Fibonacci targets in the recent past (May/June) had actually held price above. This difference was important to note currently and further confirmed the smaller time frame scenario for resistance.
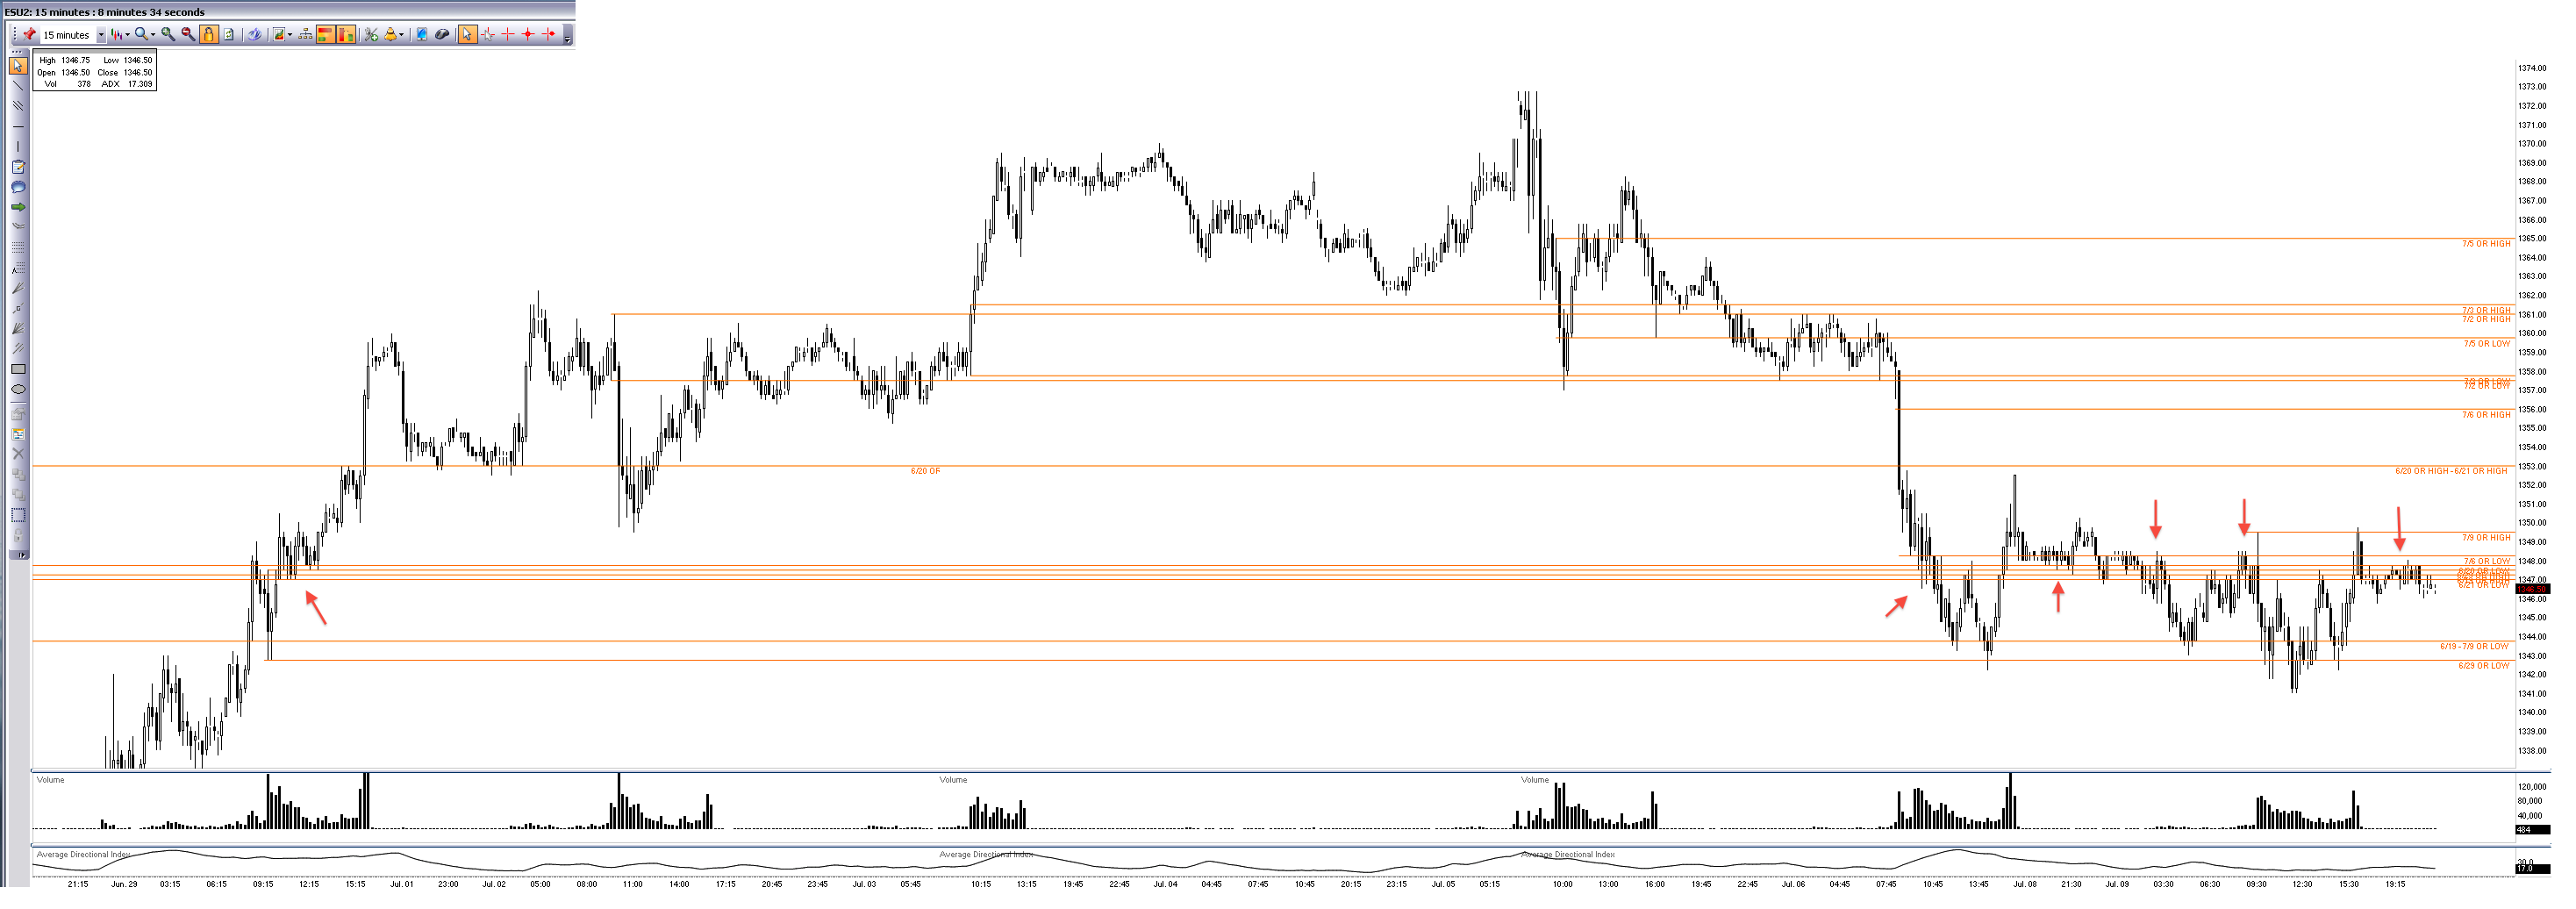
After a few days of selling I found myself looking at the same cluster of OR that sparked the move higher to the Fibonacci target. I was further intrigued that the entire session found resistance at what was once support as shown in the chart below. This chart is large and may be a little difficult to read unless full scale as it dates back to the 29th of June 12′ roughly.
Now looking at current price action, todays ON session shot right through this level of overlap like it didn’t even exist.
It was important to continue to track price with intermediate Fibonacci draws, they were pointing higher when the morning session opened. It was also important to note that the 5 EMAs had been regained off this move and the morning swoon found support at them again.
However, todays OR was lost quickly after the ON high was tested and the 5 EMAs just so happened to now line up perfectly with the middle of the OR overlap from late June.
When this level was breached and found immediate resistance, it was clear that the daily Fib, OR and 5 EMAs were in tune again. The 15m chart below shows the days OR action as of 2:30 est.
Here is also a look at the 5EMAs. The same price action followed the breakdown of the 5 EMAs as did the OR overlaps.
Its not useful to ONLY be able to hindsight trade, and there are handfuls of indicators that can work at any given time and seem foolproof… but it is very useful to be able to gather your thoughts and see price action clearly. Clearly enough to know where you have an advantage and to know that when there is an advantage to be had you can take it.
I did not trade the ES this morning. But I did solidify further a combination of patience and reaction timing.
I do have current position on in a gold ETF. Shhhhh.
The ES is now (3:53 est) at an important 618 daily retracement level 1332.62 on my chart, without a close below this the daily trend is still higher. On a 15m time frame Fibonacci needs to close above 1338 to continue the bounce.

