
I’m going to go ahead and update the bullish wave sequence that was previously outlined if the flat correction held.
UGL did not retest its actual 382 retracement a second time, but did test its projected flat correction twice at around the 61.97 level.
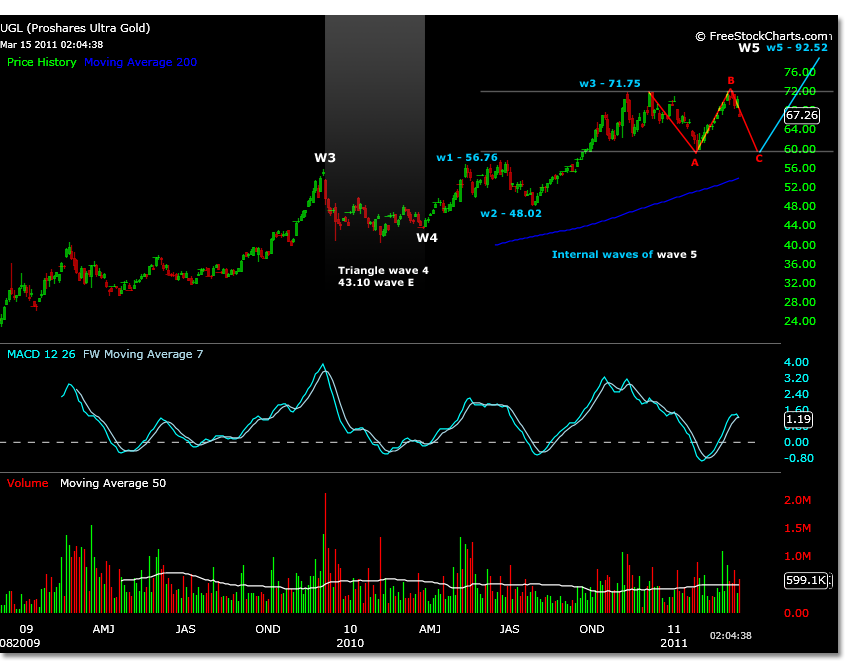
If a breakout is beginning, this completed flat correction scenario is marked up in the chart below.

The previous chart, showed room to the upside to 92.52. This price target is used in the following internal wave projections shown below using the flat correction low. The shaded area shows where price motion may be presently.

An additional chart shows the resolution within those waves which may be apparent at smaller time frames

It is worth noting that the price history of UGL is very short. These projections have been relatively accurate in the past, but have become less precise in the latest consolidation presently.
A few things to consider from the past.
This prior price chart below shows that the parent wave 3 macd still has not been breached by the present price motion, usually the sign of a wave 5 forming.

This means that the strongest moves in ULG may be in the past.
Although the weekly shows a larger macd wave, it is not a sharp wave 3 as once thought. It is still negligible, or in the early stages, if this is the start of a much larger move at the larger time frames.
Visually, the macd weekly from November 2010 analysis showed a clear picture that a larger wave 3 may form. The chart from November below.

Now look at the same weekly chart today which illustrates the marginal momentum to the upside. Previously mentioned as potential of a larger wave 3 beginning, it could now be divergence of wave 5.

All UGL posts.