Trade alerts for the given year will be posted here and tracked*. When a price target is met it will be flagged by the color blocks below. Visit trade alerts to view trading charts, buy, sell, sell stop and profit levels**.
Short term profit labled with
Analyzing Trades Initiated In 2009 (Time Frame: January 2009 – December 31, 2010)††
Because the trade signals are of both long and short term time frames, the following results show the performance of the trades executed in 2009 and the results of such trades up to December 31, 2010.
There were 31 trades initiated in 2009. In 52% of the trades executed a stop loss target was met.
This accounts for all trades in which the sell stop was triggered before or after the short term profit level was reached. But not if a sell stop was reached after a long term profit level is met.
In 42% of these trades the short term or long term profit levels were met.
100% of the trades that met short term price targets, without a sell stop level being triggered, also met the long term price targets.
†The 6% difference between trades resulting in losses or partial profits can be explained by three trades triggering sell stop levels with no following short or long term profit levels met, as well as two trades in which stop loss levels were met after the short term profit level was met.
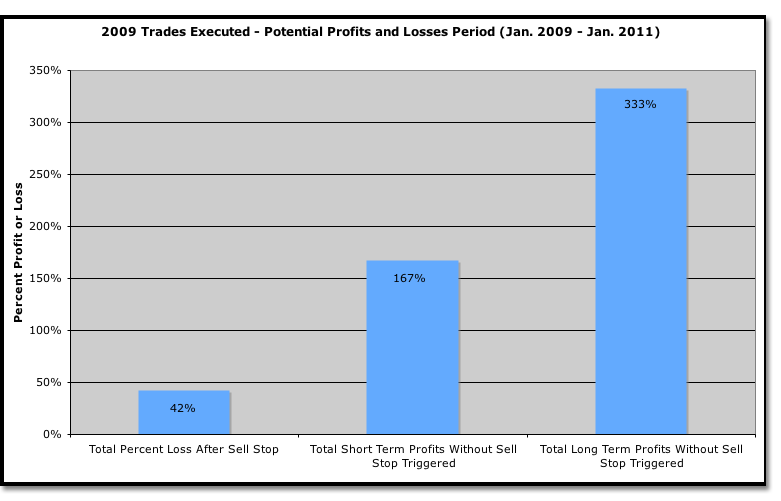
Analyzing Trades Initiated In 2009- Potential Profits and Losses (Time Frame: January 2009 – December 31, 2010)††
The total percent of short term profits without a sell stop triggered was 167%.
Total long term profits without a sell stop triggered was 333%.
125% and 291% potential short or long term gain after losses. These statistics follow the sell stop and profit levels exactly as if automated upon date of buy signal.
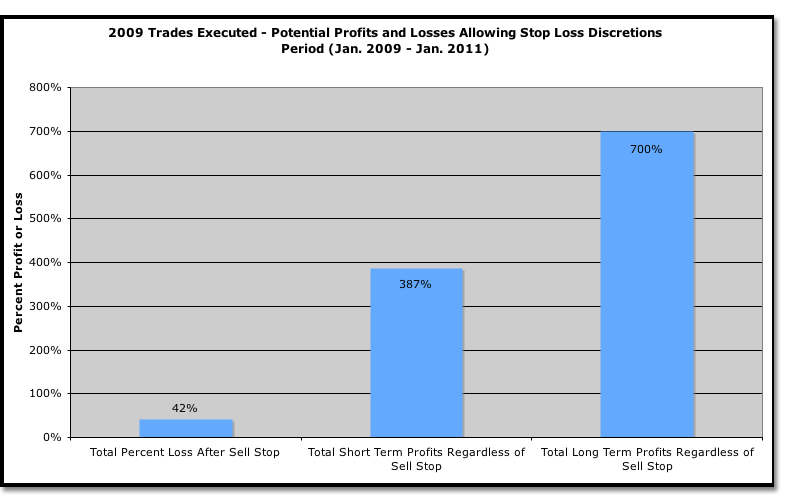
Analyzing Trades Initiated In 2009 (allowing stop loss discretions) Potential Profits and Losses (Time Frame: January 2009 – December 31, 2010)††
The next list of figures takes into consideration non automated trading executions where the trader or investor may have entered a similar trade with his or her own trading strategy, approach to execution or trading time frame relative to any of the 2009 trading signals issued and expectations.
The result of including these scenario as possible is to allow insight into identifying the direction of price motion within a broader set of investment factors than the trades themselves allow and emphasize the importance of timing.
Also, displaying these results is not meant to support the concept of buy and hold or the possibility that a stock will always recover its losses.
Of the 31 trades executed (allowing stop loss discretions), total short term profits regardless of sell stop where met for 387% gain in the given time frame.
Total long term profits regardless of sell stop where met for 700% gain in the given time frame.
345% and 658% potential short or long term gain after losses.
††Disclaimer to all figures. The trade signal issued for ETFC on Monday July 22, 2009, resulting in a short term profit level met of 45% followed by a reverse split 1:10 by which the long term profit level was met, was not used in calculating potential profits or losses for any data presented above. Trade signal issued for UNH on 08/06/09, resulting in a long term profit level met of 55% after the stop loss was triggered- this long term profit was not used in calculating potential profits or losses for any data presented above because it was triggered after the sampling dates of the profits and losses analysis for 2009. Trade signal issued for SAH on 09/17/09, resulting in a long term profit level met of 45% after the stop loss was triggered- this long term profit was not used in calculating potential profits or losses for any data presented above because it was triggered after the sampling dates of the profits and losses analysis for 2009.


