This will be an information rich post for anyone who gets lost in the wave counts from time to time, myself included. Time frame is the most elemental key to using Elliott Waves and also maybe the most difficult part of the Elliott Wave to keep in check.
Eastman Kodak has been on the radar since September 2009. Here, in the last post, we did preface a trading call by stating the move from 3.26 could have been the internal wave 3 of 5 and indeed it may just have been. Also in the post on EK from 2009 we talked about the parent wave 3 price target.
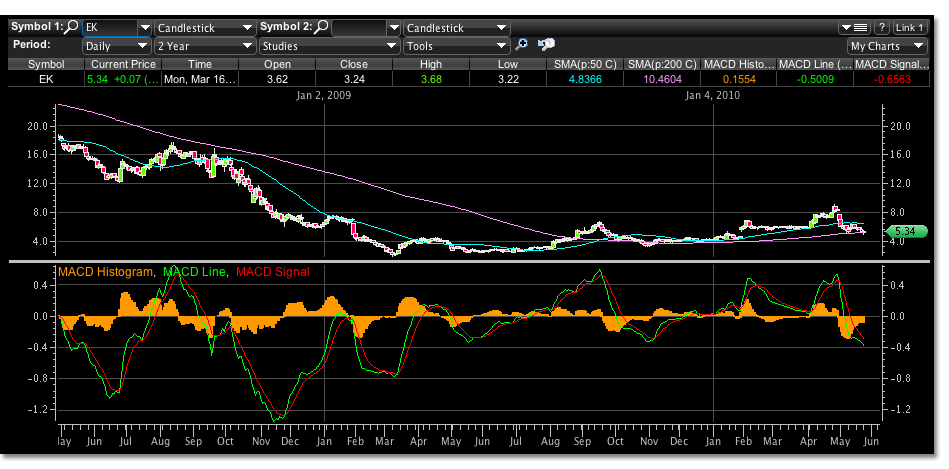
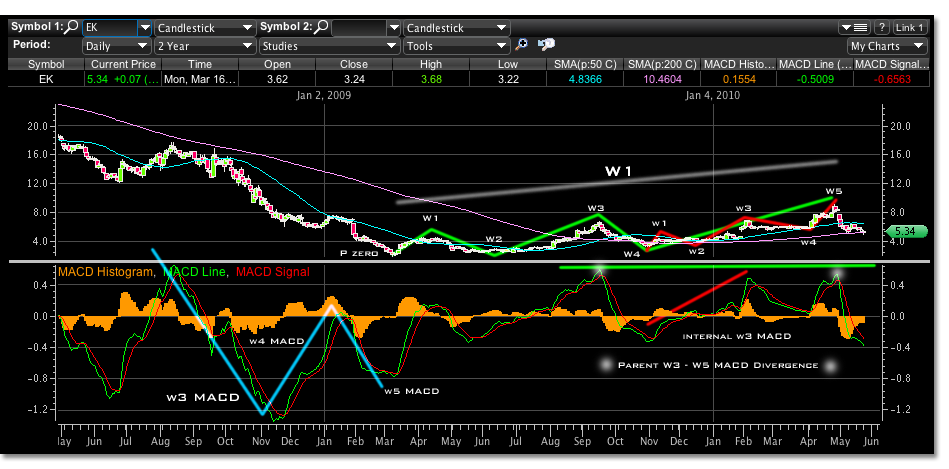
Ok, hopefully looking at the diagrams set up below will clear things up. If you had lost track of the time frame with this trade you may have thought that the previous post and high of 6.82 was forming a double top. As you can see the parent wave 3 in green and the internal wave 3 of wave 5 are almost exactly the same price. To exit the trade at this point would have left 32% on the table.
Lets start from the beginning. The first image above is without mark up to help visualize the price motion behind the wave counts. The mark up image below beginning with the light blue wave in the macd technical indicator shows how we developed the p zero price, or the beginning of our parent wave 1 count. It shows that the largest wave is wave 3 and the divergence between the macd wave 3 and 5 results in a lower price low but a smaller momentum reading macd.
Next we can see at the parent wave 3 price that the macd reading is the largest wave of the preceding readings since our p zero point. That is how we determine that this is a wave 3 price target. The next peak in macd is the internal wave 3 of the parent wave 5 and it appears like a double top at this time frame.
If you did not use a larger time frame to determine your place in the Elliott Wave count and macd reading, you would not have known that this particular lower low in macd to the parent wave 3 would also have to result in a higher price. If this were the case you would not have actually been seeing the parent wave 5 divergence.
The internal waves of parent wave 5 are shown with a red line. From the internal wave 3 of parent wave 5 to internal wave 4…well thats the epitome of a flat correction visually, but referencing a retracement level it calculated correctly. The previous post was looking for a simple correction here in which the C wave would reach 4.40. This was not the case.
Demand must have been extremely high for EK at this point. Also, because the internal wave 2 of wave 5 only corrected by 38%, by alternation we should have gotten a larger correction visually than we did in internal wave 4. However, we still did satisfy the rule of alternation as the 5.55 low was 2% off a 42% correction objective creating a larger alternating correction to the previous.
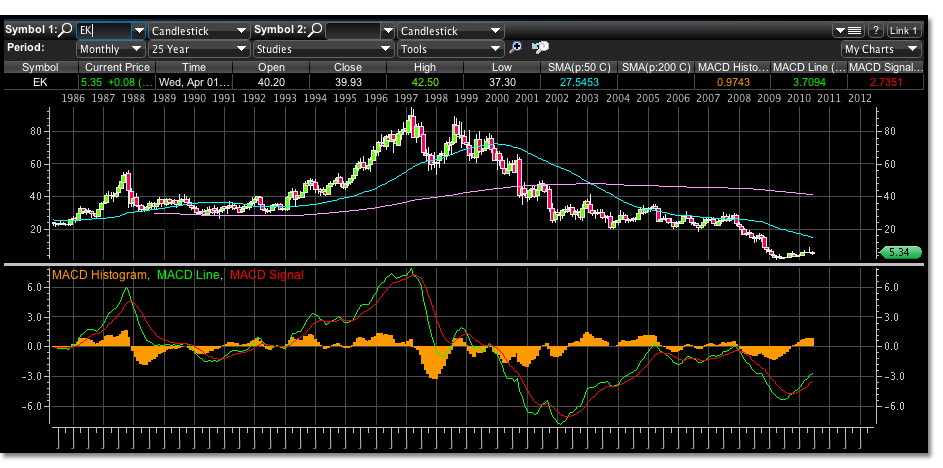
Remember from p zero to parent wave 5 is in itself a parent wave 1. This is shown with the gray line above all, labeled with W1 in the mark up diagram. This is most certainly the lowest low on an even longer monthly chart shown above, and we can see that the divergence of wave 3 and 5 in the macd is reflective in a lower low in price to 2.01.
Notice in the markup parent wave 3 and wave 5 of parent wave 1, that if you isolate the parent macd readings from the internal macd readings, which is sometimes very hard to do, you can see real divergence shown by the horizontal green line and the peaks outlined in white bursts. This represents what is meant when someone describes divergence using the macd. It can only be between a wave 3 and a wave 5 of a relevant structured time frame. Here we can see that there was detail in the macd between these two points that without proper reference to time frame would have been incorrectly represented and misinterpreted.
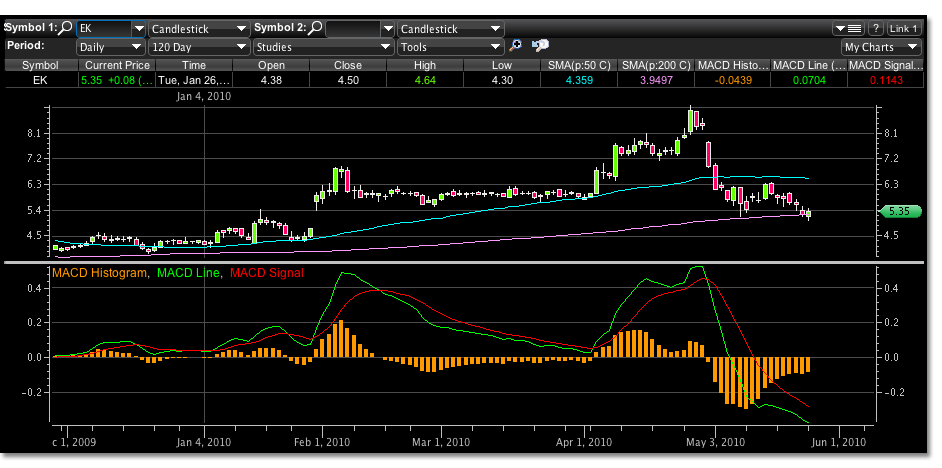
Furthermore, if you happened to look at a shorter set of daily bars, say 120 in the chart below, you would only see the internal wave 3 and this parent wave 5 macd. You would say to yourself without seeing the larger picture that because the higher priced wave is also larger in macd reading that this 9.08 high may be the wave 3, mistakenly. The subsequent correction would then most likely take you to a negative position by surprise.
Without closely following the time frame you are using to trade, the detail that you require to discern trading signals can be easily lost. The daily charts we’ve marked up do a good job to show the difference between an internal wave 3, its parent and a parent wave 5. As well as the development of a p zero point. However, between all these highlighted points there is detail that is lost at this resolution, the daily time frame. There are many signals within the markup here in which a smaller time frame is necessary to call a top or a turning point bottom that correlate with the Elliott Wave count, its calculations and the macd.
At present, the parent wave 1 labeled gray has been in a correction. If everything we have illustrated holds true, a simple ABC correction retracing 62% of the move would be 4.71. The 5.33 level that was the closing price today after reaching a low of 5.03 is a 53% retracement level. Its hard to say if the push to 5.03 was the end of the correction. Thats a 6.5% difference, still substantial. There were over 750k shares traded in the first two minutes of trading. That could symbolize a point of short term capitulation, but much larger lots have traded in previous higher priced days.
A trade could be put on with 5.02 as a sell stop realizing that the low of wave 2 can correct up to 100% of its move. There is too much risk to think that 4.70 will come and go quickly especially in this market. Possible levels not at the extreme 100% would be below 4.00, from 3.70 to 3.35.
As well, a 62% retracement of the correction so far, from 9.08 to 5.03, would give you a price target of 7.53 to the upside. Todays price action shows room to 6.90 or the 50 day moving average if the low holds. If the market rebounds here, these targets would be a good place to reevaluate a long position if you have been holding. This price target could then create a final C wave to the lower 4.00 price targets we spoke, or setup a successful retracement to solidify a internal wave 2 of parent wave 3.


