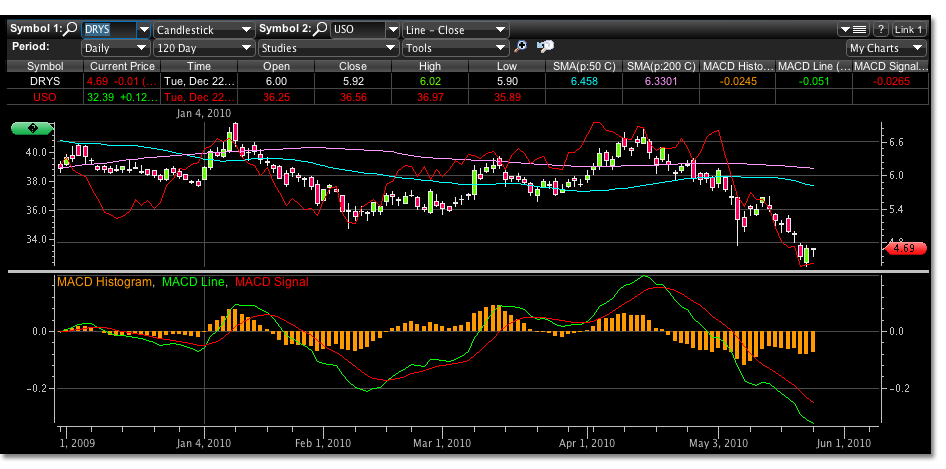
Last week the trading of EXM and DRYS was on the watch list for potential bottoming process in play. EXM has continued to show volatile strength to the upside while DRYS has shown some signs of its volatile downside beginning to tire.
After EXM traded past its May 6, 2010 low we said that there wouldn’t be much room to fall further if the technicals held up. The target price of 5.35 was to be support with 5.20-5.13 crucial accumulation levels if the short term downtrend was to reverse. EXM opened the very next day, with the pre markets set to open over 120 pts lower, having traded only 500 shares at the 5.31 price. The stock opened at 5.37 then held the 5.20 level, only trading 2k shares, then on Friday dribbled down briefly under market pressure to 5.16 on only 3k shares before rallying over 11% to 5.76 on 1.69 mil shares. The move off the projected lows that have held is encouraging, but this one days over performance will be tested. The outcome should be used to set up a new trade, possibly to the upside again.
DRYS also saw some encouraging trading but with a few less fireworks, rallying off a new low 8%. Although short interest is still high, there were signs that got the pot stirring to note. One being that there were new exchanges taking part in the trading at large size. NITE, UBSS and MWSE were noted. UBSS specifically was tracked prior to have sold over 540k shares at the top of the last short term uptrend and 5.60. Now they are back in the bid seemingly. There are many big lots crossing. Over 400k at the 4.39 low at the open on Friday May 21, 2010, 600k at the relief rally and then over 900k at the flat line of the day 4.70. The lows may be tested this week and DRYS should show traders which direction these new exchanges and volume is headed.
Also with DRYS there has been a correlation with the USO and performance of oil. Look specifically at a 120 day chart to notice if this is the case for other shippers as well. A rebound in oil could turn these shippers around. Whether that is coming or not is questionable. Yet, oil seems to be displaying some of the same trading patterns and should be followed in suit as many shipping stocks are showing a near term correlation to the price of oil shown below. The red line overlaying the candlestick chart is the USO.

