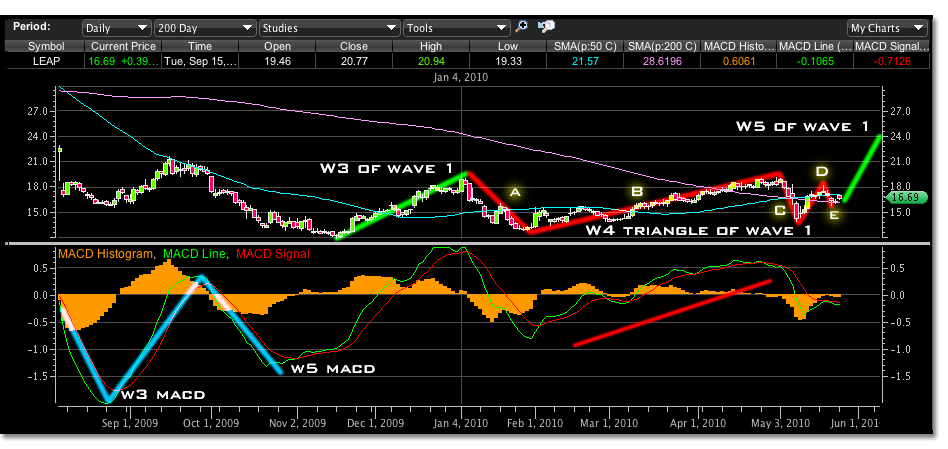
We looked at an EK daily price bar chart the other day to analyze how its trading time frame appeared to be developing relative to the macd readings. Looking at this Leap Wireless (LEAP) chart below it appears that a similar pattern is occurring although the wave 5 has not occurred yet.
Currently it looks like LEAP was at a double top and has been retracing, but this was an incorrect assumption when we were looking at the EK price chart that showed similar patterns and continued to much higher levels. Is LEAP going to follow the same scenario just because the charts look similar? What exactly is happening in LEAP and what may be an alternative to the same chart pattern?
Lets map out the daily chart like we did in EK. The previous downtrend is reversed by macd wave 3 and 5 shown in the light blue color. The highest macd reading after the zero point on this daily chart would be wave 3. In this case it is wave 3 of parent wave 1.
If we were to interpret both the EK chart and LEAP chart the same, we would be expecting that the next wave in macd seen in the mark up chart above with a red line, like the internal wave 3 of wave 5 in the EK chart, should mean that higher prices are coming and that the double top perception is just that. Also however, a closer look at what is labeled wave “C” would reveal that a lower low than the May 6, 2010 spike is first needed.
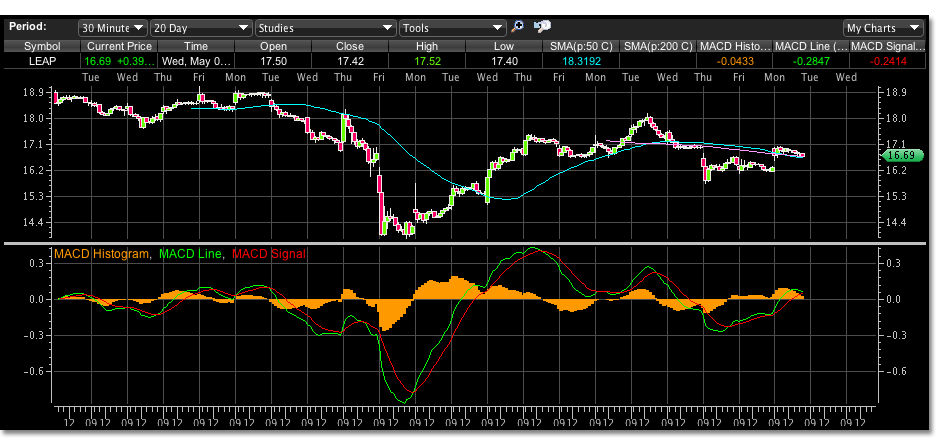
The trading pattern in the chart below represents the macd at the 30 minute level and shows that a large wave 3 has occurred on the May 6, 2010 spike that has not been retested and a lower low in price made.
Here is why higher highs might still be the case but without the lower low first and with a different technical trading analysis supporting it.
We’ve said in the past that when a wave 3 macd is made that its divergence to wave 5 macd will result in a lower low and a turning point. Should we expect a lower low in LEAP before we climb to a higher high above the 19.21 level because there is no divergence with a lower low yet in the 30 minute chart? Not necessarily. Divergence is only relevant when the price motion of the chart is actually within a trend that contains a wave 5 sequence.
There are many waves of macd that are not part of a 5 wave sequence and may be insignificant to the larger trend move. There are corrective waves in both uptrends and downtrends, and not every corrective wave has been identified to have 5 waves or any correlation to a macd reading. More so, the elements the Elliott Wave in each trend are held together within the Fibonacci count of the waves and the macd only signals turning points during a 5 wave sequence by identifying the largest momentum to be a wave 3.
While looking at LEAP things may appear to be foretold by also looking at the chart of EK, but if what appears to be internal wave 3 of wave 5 macd reading is not that, then what is it? It looks almost identical to the EK chart but at a different stage in its progression. The alternative analysis on this chart begins with the idea that the macd wave which was internal wave 3 of wave 5 in EK, here in LEAP is actually wave “b” of a entire wave 4 triangle formation. A triangle formation does not follow an Elliott Wave count, and would allow for a trading in LEAP to continue higher without breaking the May 6, 2010 low.
Concerning macd divergence, this particular macd wave does not correlate to or represent this at all because there is no divergence to track here until the wave 1 of wave 5 begins. In a wave 4 triangle the price zero point of wave 1 of 5 does not begin at the lowest price of the “a” wave of the triangle, it begins at the end of the triangle at wave “e”. And that may be were LEAP is trading today.
If this analysis holds to be the case, the triangle wave 4 will end at 38% of the wave 3 magnitude. Using actual prices and not projected, that price would be 16.44. Using this price to project future prices for the five waves of wave 5, price motion could look like this. 18.45 for a wave 1 target, 20.91 for a wave 3 target, 23.68 for a wave 5 target. The correction waves 2 and 4 could vary, but projected at 62% and 38% respectively they would be 17.19 and 19.20.
Breaking out of this triangle formation is usually a very volatile trading event and a tight stop should be used to protect yourself if this analysis fails. Waiting to see if the projected wave 1 of wave 5 develops and corrects, is the safest way to enter the trade.


