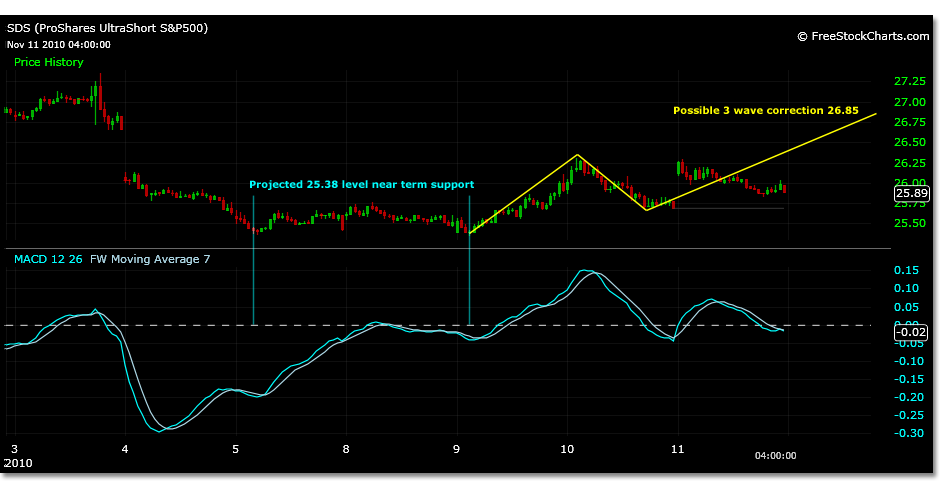
Last week the SDS was trading into new 52 week lows. Two projections were made for possible support in the SDS.
The 25.38 price level was tested on two occasions and then on Tuesday 9, 2010 SDS traded to 25.35. SDS has since traded higher. SDS could possibly continue to trade higher short term to 26.85. This would be an ABC corrective wave higher, not a 5 wave trend, since the trend has continued to be lower to this point.
There has been some divergences developing in short term MACD charts, but may not have been tested significantly enough from the latest move lower in prices for the SDS.
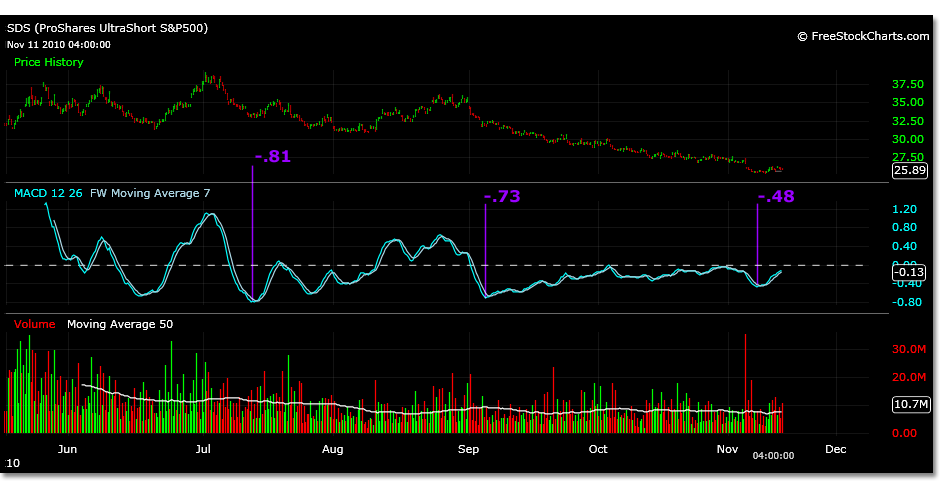
A look at the SDS using a 2 hour chart MACD can reveal that the prior wave 3 created on 9/3/10 has now been tested to 52% of its low with the current move to 25.35. A more satisfactory test would have been 85%. Reference the prior MACD levels in the chart.
A future MACD reading from -.54 to -.62 at this time frame could confirm the end of a longer term downtrend if the -.73 level holds and this latest move does not hold up. MACD can be dangerous to use in determining the end of long term downtrends if a specific projected price is also not being used. MACD divergence will not be relevant or occur in a corrective wave unless within the last 5 waves of the C wave relative to time frame.


