
Tellabs Inc has been analyzed on both short and long term time frames. Initially in late November 2010, a triangle trade was projected on a weekly chart and more recently a flat correction was seen on a 30 minute chart as a potential breakout pattern.
What has not been discussed or acknowledged in the TLAB chart is how the current price motion may be more relative to an internal wave structure count than the larger weekly count previously analyzed.
In the weekly triangle trade write up, little diagnosis was attempted to determine the parent wave 1 structure of TLAB. Perhaps the most important wave, as all projections are relative to wave 1 magnitudes.
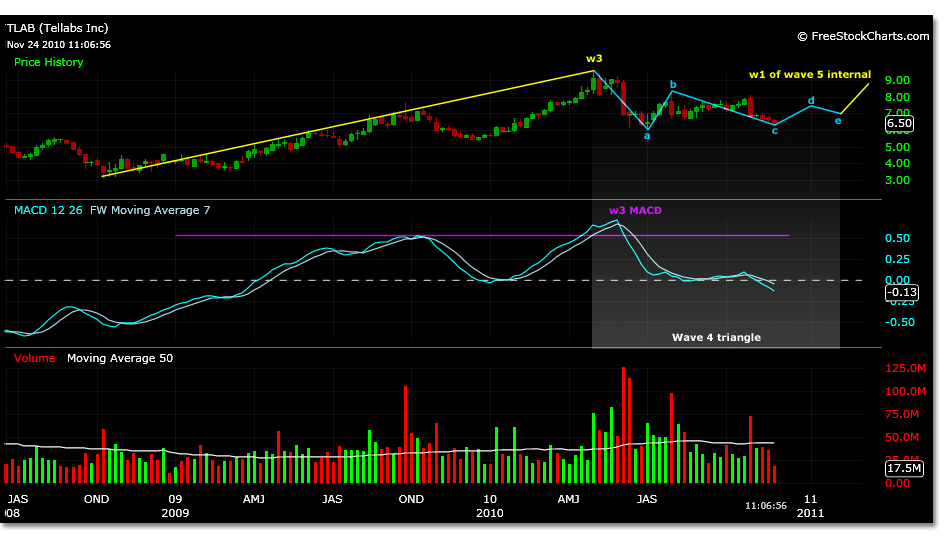
It was obvious in the prior weekly chart to see the MACD correlate to a wave 3. It was further obvious to see that a triangle wave 4 was developing- seen in this chart.
However, because parent wave 1 was not identified, what may have been missed is that the likeness to wave 3 and 4 is not of the larger trend, but an internal trend.
It is possible that the MACD reading from the weekly chart is an internal wave 3 of parent wave 3, and not the parent wave 3 noted in the above chart.
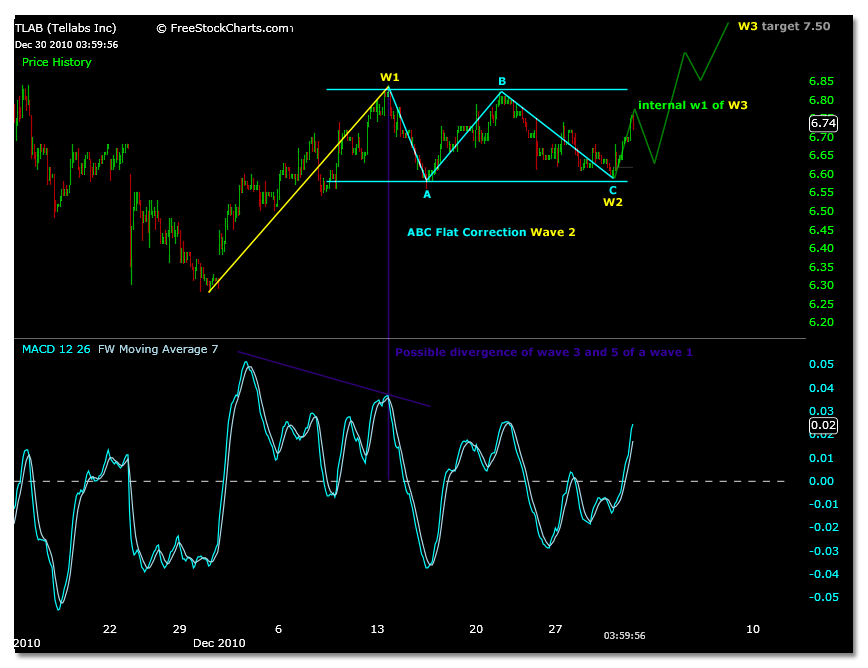
A new chart below describes the wave formation that would be apparent if parent wave 1 was established. The outcome still retains the wave 3 MACD and the triangle wave 4 pattern, yet it may provide more accurate price projections. As well, it could explain why such a strong correlation to Elliott Wave counts has recently been recognized within the triangle formation- if in fact TLAB was still in the triangle as suggested.
What the analysis hopes to provide is evidence that the parent wave 3 is not yet completed, that wave 3 of 3 internal and wave 4 internal of this parent wave 3 are what is evident on a weekly chart, and relative to the current price motion in TLAB.

Using a weekly chart, the 3.10 low of 10/10/08 is used as the price zero point. The parent wave 1 magnitude will be measured to the 7.36 high on 10/16/09. This price high for wave 1 is being used based on calculations of the internal waves of wave1 correlating to this price with relative accuracy.
Once this parent wave 1 is established it becomes apparent that the parent wave 3 calculation does not correlate to the previously illustrated wave 3 at 9.45 of 4/30/10. Instead, this parent wave 3 calculates to 12.62. The parent waves are shown in yellow.
The current triangle correction seen in a weekly chart may be the internal wave 4 correction of internal wave 3 of parent wave 3. The calculation for internal wave 3 of parent 3 using the parent wave 1 magnitude is 9.60. The internal waves are shown in light blue.
This correlates to the 9.45 price high and still maintains the wave 3 MACD reading. If this is correct, then higher prices viewed at this time frame will show divergence in the MACD between this internal wave 3 and its wave 5. This MACD scenario is shown in purple.
The projected parent wave 2 is 5.73 for a flat correction and 4.72 for a simple correction. The actual wave 2 price is 5.36. This actual price correlates roughly to a 48% correction. A wave 2 can not be a triangle correction so it will be assumed that the simple correction expected fell short of expectations.
Using the projected wave 2 low of 4.72 and the actual internal wave 3 of 3 high of 9.45, the closest correlation to the parent wave 3 price target is attained. The completion of a 5 wave structure using parent wave 2 price zero calculates to 12.37.
It is not uncommon to find the closest correlation in Elliott Wave pattern counts using a combination of actual and projected prices as well as a combination of closing prices and either low or high prices of specific magnitudes in price motion.
Now that a fairly strong correlation is established for a possible internal wave count of parent wave 3, the price projections of internal wave 4 of parent 3 can be projected. These prices differ slightly from the original parent wave 4 projections.
Wave 4 internal triangle of parent wave 3 price motion:
A wave-projected 6.53 actual 6.10 close 6.48
B wave- projected 8.35 actual 8.19 high
C wave- projected 7.26 actual 7.14 close
D wave- projected 7.99 actual 7.92 high
E wave- projected 7.63
The internal triangle E wave does not follow this internal triangle pattern very well, but did not break the A wave low.
However, referencing the parent wave triangle price projections, it is interesting to note that the 7.00 wave E price projection correlates very accurately to todays break higher in prices. This short term chart of TLAB shows the breakout of a triangle at a smaller time frame from this price point exactly. This chart follows the flat correction diagramed previously.

Considering the apparent internal Elliott Wave counts diagramed in this and previous posts, as well the correlation to the larger time frames wave E price, TLAB could be showing signs that the internal triangle wave 4 is completed, and internal wave 5 of parent wave 3 has begun.