EXM was trading nicely within a possible wave 4 triangle pattern since the 6.63 top formed on 11/11/10. With the trend since the 7/7/10 low of 4.59 being higher, some may have expected this triangle to break higher and not lower.
The most current trade signal issued on EXM was expecting this and the sell stop was triggered. In doing so, yesterdays trading broke what could have been the A wave low of the triangle formation at 5.44.
One alternative to the triangle wave count, that would sustain the uptrend in EXM, would be that a parent wave 2 has not broken 4.96 on 8/25/10.
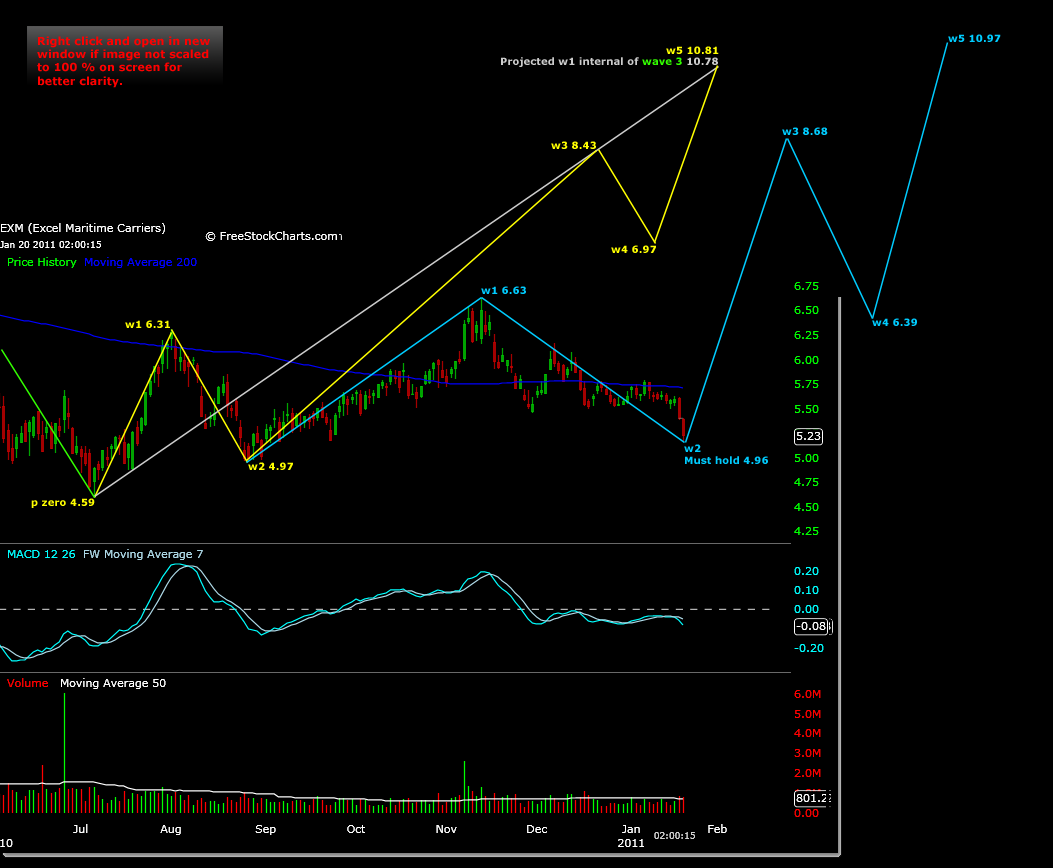
To clarify this price point, analyzing the MACD since 7/7/10 does show a divergence between the price peak at 6.31 and 6.63, however price projections do not correlate to a wave 1 top at 6.63 from 4.59. Instead, trading in EXM must hold the 4.96 trading low, an internal wave 1 structure, if the following price motion analysis is correct and the intermediate trend is to continue higher.
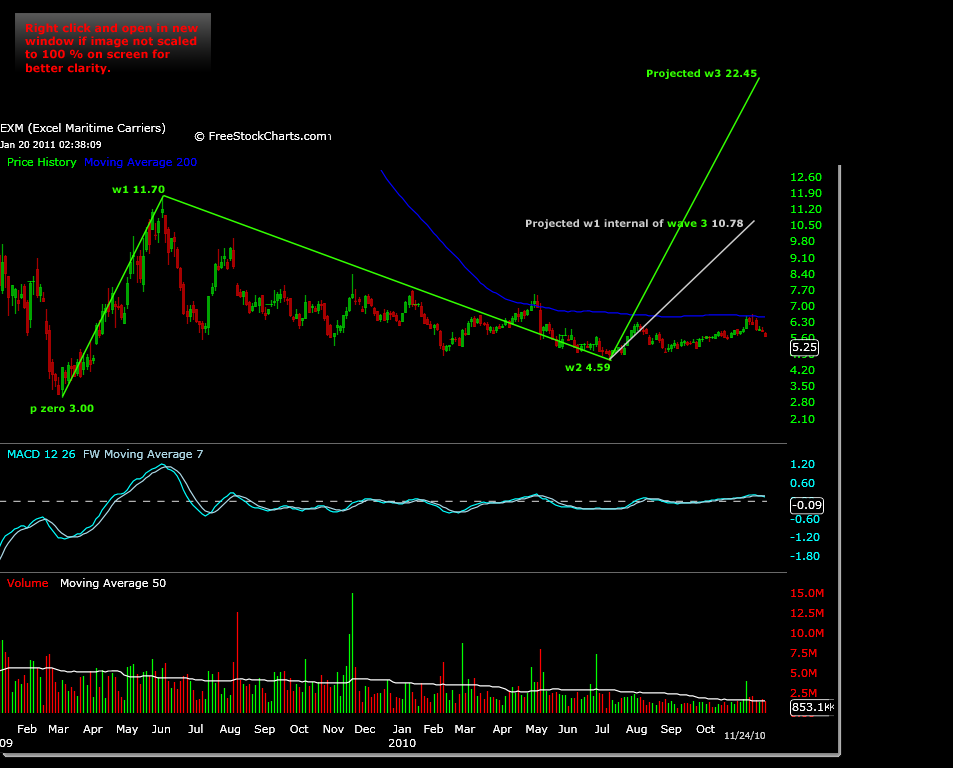
This first chart is a 2 day time frame chart that shows trading in EXM from the 3.00 low on 3/4/09 to the 11.70 high on 6/2/09 as a possible wave 1. A wave 2 can correct up to 100% of its wave 1.
The correlation between this longer term chart and the current trading in EXM since the 4.59 low on 7/7/10 could be the development of this parent time frames internal wave 1 of wave 3.
The parent time frame is shown with green trend lines above. The internal wave 1 of 3 of the parent time frame is shown with a gray trend line above.
There are two internal wave structures developing within this wave 1 of parent wave 3, shown in the chart below.
The first internal wave structure is shown with yellow trend lines. This is another possible parent wave to the current price motion, and the beginning of wave 1 of wave 3 (referenced gray above).
The second internal wave structure is the yellow trends internal wave 1 of wave 3 development, shown in blue trend lines below.
The correlation in analysis of all of the wave structures just illustrated is that each projects to a very similar completed 5 wave price target of their given time frame, and these price targets match the parent trends price target for internal wave 1 of 3.
Time will tell if these projections are not correlated to higher prices and the break in the triangle formation was not random. But, if their symmetries to past price motion is signaling a confirmation of the larger trend, then EXM price targets could be higher.
Understand that a break in price of 4.96 could lead to new lows towards 4.50-3.95. Making new lows could still eventually show support to the prior trends potential wave 1 (from 3.00 – 11.70) shown in the first chart, however this is over 17% lower and a long way from the initial analysis of the triangle formation breaking higher.


