
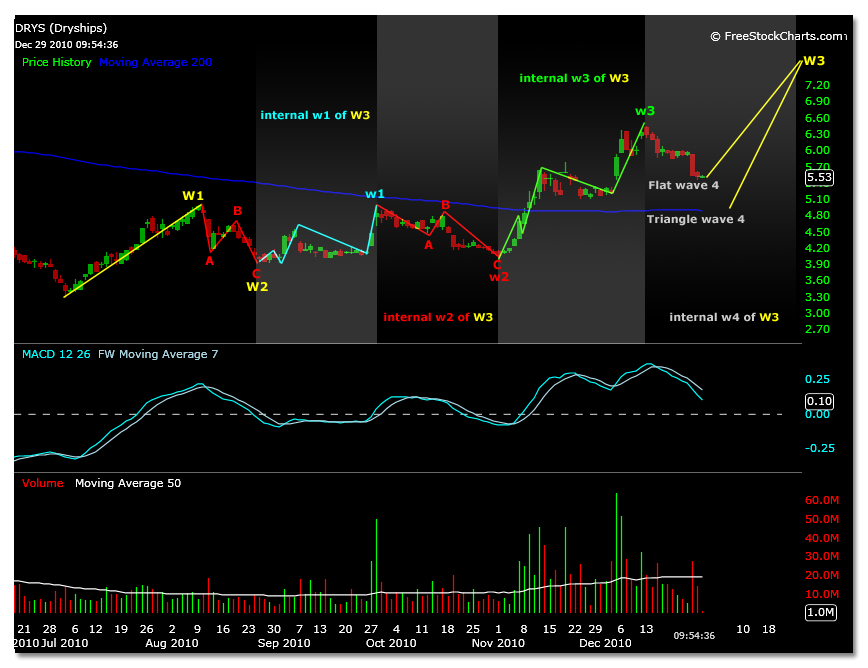
Today DRYS traded to the projected triangle wave A correction price of 4.88. This price was calculated using the 3.92 low and 6.44 high shown in the previous chart as wave 2 in red and internal wave 3 in green.
The prior analysis also outlines the most likely Elliott Wave formation that has been developing in DRYS so far- this triangle could be an internal wave 4 of 3.
Although todays trading action does come with correlation to prior technical calculations, based on the prior Elliott Wave count, there are a few other scenario apparent in the internal price motion of the DRYS chart that should be kept in mind.
The first chart below shows a 5 wave corrective sequence. A wave 1 magnitude is formed from the initial 6.37 price high on 12/6/10 to the low of 5.90 on 12/8/10. This is shown at the 30 minute time frame. Using this magnitude, and referencing the MACD indicator for correlation to a 5 wave count, the projected low is 4.67.

An additional way to count the internals of the current correction is using an ABC correction formation. In this case the 5 waves projected occur in the C wave. The low projected is 4.30, using a wave 1 magnitude derived from 6.44 on 12/13/10 to 5.85 on 12/15/10.
This scenario is shown in the chart below. If this scenario is to unfold it could be possible that the current lows hold long enough to form another wave 4 top before continuing lower to a final wave 5.

In each case, calculating projections using the absolute highs and lows within each wave sequence in a stock at such price levels can obviously make a small difference in wave magnitudes into large differences in price projections.
It is always easier to wait to see a bottom, and trade with measured conviction, than pick one subjectively. That said, DRYS is currently showing traders some of the prices previously projected.
If the current price seen in DRYS is an indication of the triangle formation previously analyzed coming to fruition, than a rally towards 5.85 (projected B wave of triangle) should ensue before a pullback within the triangle.
If a rally from here is cut short, or if the sell off continues without breath to the upside as it has, then DRYS will likely make smaller and smaller wave 4 tops as it seeks wave 5 lows projected at smaller and smaller time frames.