
In early January UGL and GLL charts were looked at for possible Elliott Wave formations and price targets.
UGL was speculated to be at an internal wave 3 of 5 top and possibly in the midst of a flat correction shown in this chart.
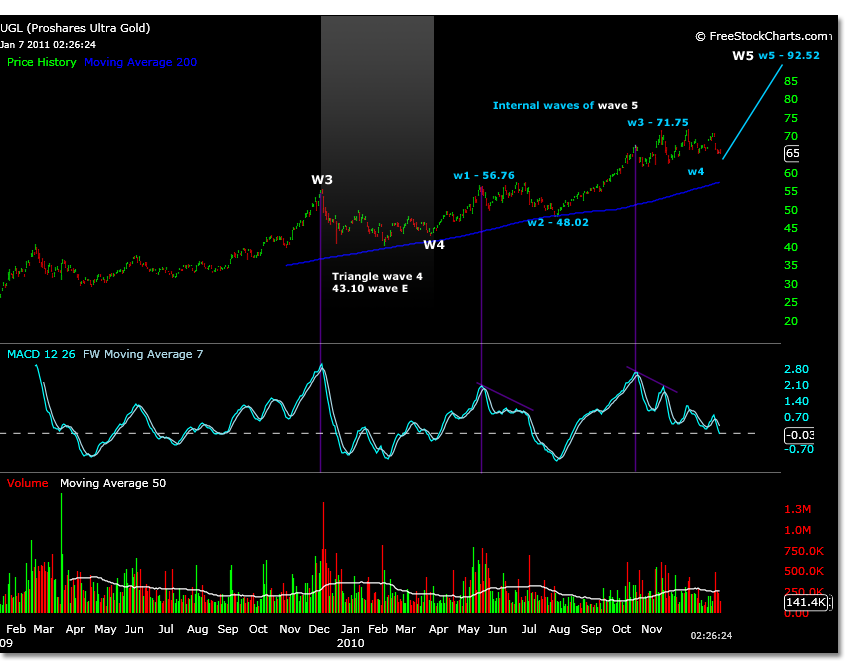
Trading in UGL since this time has added to the analysis that the 318 support level for UGL at 61.89 and a flat correction may be developing.
A two-day chart below updates the correction scenario for a flat correction internal wave 4 of parent 5.
At this stage, it is anticipated that UGL will pull back towards its wave B level completing the C wave of a flat correction.

If this level does not hold a more pronounced triangle will likely develop. The prior post analysis notes the triangle price targets, as well as wave 5 targets if support is held.
The internal wave structure and higher price targets in UGL at this stage, and in past analysis, are based off larger time frame trends, spoke of in November 2010 (Nov. 2010 post).