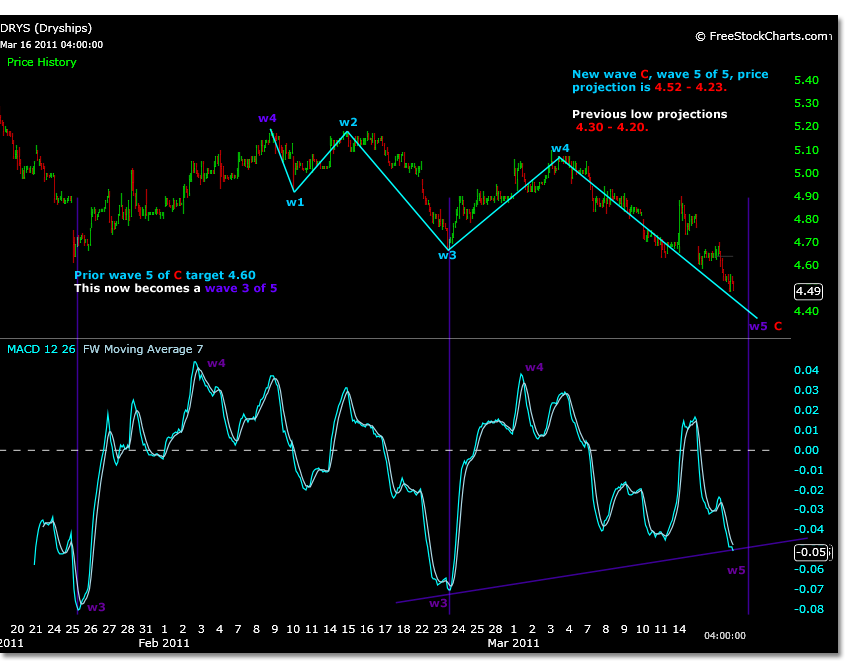
The January 25, 2011 low of 4.61 was close to projections and created a fair move in the stock 12% higher.
However, as 4.61 was broken this low now becomes a wave 3 low, and not the final wave 5.
Prior analysis (link) projected this case as an extended correction scenario and in this prior chart shows targets for 4.30.
A wave count for 5 waves of 5 can be projected from prior resistance at 5.18, now a wave 4 count. This is marked up in the chart below.
Looking at a 30 minute time frame chart shows that the 4.61 low was a wave 3, and that the subsequent trading from this point to the the 5.18 high was a wave 4.
These wave counts are not only based on prior calculations but present MACD readings/counts shown in purple. Internal wave 3 of 5 is confirmed by the extended MACD reading, and wave 5 targets are remaining diverged at this point.
The present wave 5 projections are in a similar range to the prior extended price projections and calculated using the magnitude of wave 1.
The range given depicts the difference between an absolute low of wave 2, as there seemed to be a quick washout in price, and support at the 5.00 level.
A trend line drawn from the 3.92 lows also may support these price projections if any turn in price motion will occur.
Failure to support this price range and the prior 3.92 wave 2 low, shown in this prior chart, would negate the uptrend from 3.28.
If this should occur, the run from 3.28 to 6.44 will itself become a wave 4 and wave 5 prices would exceed 3.28.

