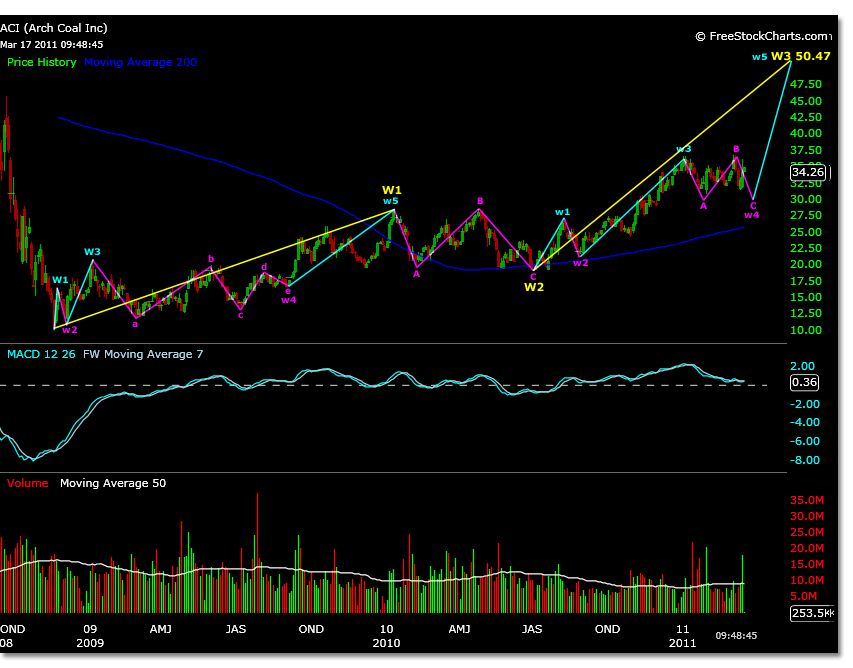
ACI showed strength into the markets sell off over the past few days. A small channel has developed from the 36.50 to 31.50 roughly.
One particular scenario for the Elliott Wave formations in this stock has the present pull back as relatively shallow as it has so far been.
Yet, unless ACI breaks through its current highs and begins the next wave, its current internal wave 4 price range may take longer to develop and probe lower support between 29.95 and 27.00.
The move off the parent wave 2 low shown in yellow type, spots a .382 correction right around where the first low marked A in pink is shown in the chart below.
This could be a flat correction wave 4 if the 29.95 level holds. The chart is marked as such, but these are projections based on the past price motion, only present price motion can confirm this.
It is too early to tell if this correction is complete or even if the AB or C waves of this internal wave 4 have been established. The 30.00 mark was barely tested at projected wave A, but large volume was there.
Wave 4’s normally take the longest to develop and hold the most amount of indecision of all the waves. An example of this can be seen in the triangle wave 4 of parent wave 1.
Support should be found at internal wave 1 of this parent wave 3 if this Elliott Wave count is correct and a flat correction fails. This level is also close to the 200dma, a 50% retracement from parent wave 2.
In the chart below correction waves are labeled in pink and bullish waves in blue. The parent wave structure is marked in yellow.
Smaller time frames show some correlation to this Elliott Wave Count in the MACD. This is a 2day chart and does not show good divergences but encompasses the time frame from price zero.
If this count holds true the current highs on MACD at the daily time frame should be exceeded as parent wave 3 price is reached. Some divergence in MACD should be seen at smaller time frames.
This wave count and projections is derived by using actual prices of 10.43 and 28.34 as a magnitude for parent wave 1. Parent wave 3 is projected to be 50.47.
The internal wave 1 of 1 can also be used to correlate similar structure. 16.10 was the absolute high of internal wave 1 of 1. Using this magnitude, calculations for parent wave 3 come to 56.26.
These two price targets create a range around what would be a 161.8% move off the low of 10.43 to current highs, at approximately 53.00.

