Right now JASO is trading down, close to the 6.26 low. Breaking this low could open up the possibility of much lower prices for JASO.
The prior post outlining these correction scenario can be found here.
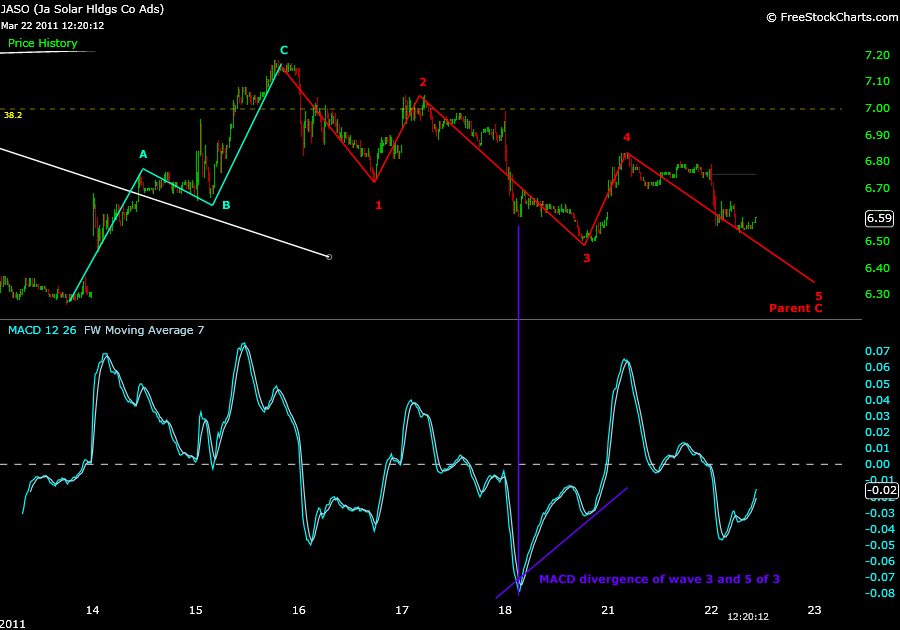
An update to the latest trading action begins by looking at a 5 minute chart below.
The white line coming in from the left of the chart is the prior down trend line from the peak at 8.57.
It was clear that this trend was broken, but the wave structure may reveal that support below will be broken as well.
This reasoning is based off the chart showing three wave ABC formations to the upside, marked in light blue, and solidly formed 5 wave sequencing to the downside marked in red.
The C wave of this particular 5 wave formation shown calculates to 5.50.
This is similar to the larger time frames projection for an ABC correction shown in the prior analysis.
Even though the duration period (chart – post) is showing JASO in a buying period, the current price action is signaling that the prior parent wave 3 was more significant to longer term time frames than prior tops above trend line and possibly requiring a more significant pullback.

