Seeing Elliott Waves In The SPX

Elliott Waves are visually everywhere and yet only exist when mathematically confirmed with the MACD structure.

Without confirmation, Elliott waves can be relative to small moments of price history and not be relative to larger moves or the trend- not relative to an all inclusive picture of the price motion in this regard.

Some Rules on Elliott Waves:
All wave 1 structures are dependent on wave 2 being maintained. The magnitude of wave 1 is the mathematical key that keeps all internal and parent waves structure intact.

Wave 3 is the strongest of waves and most volatile.

Wave 4 is the most complex of the waves and often the most time consuming.

Wave 5 carries less momentum than wave 3.

The SPX:
I do not follow the SPX relative to an Elliott Wave or have any position in the SPX currently.

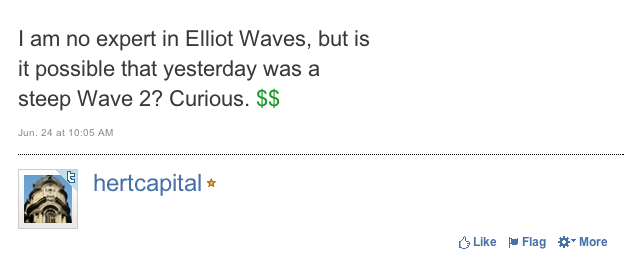
I was only compelled to look at the SPX in this manner after hertcapital asked a question about an Elliott Wave pattern off the StockTwits feed.

hertcapital_tweet_2011-06-24-at-12.16.46-PM.png

If there is anything going on in the SPX right now relative to an Elliott Wave sequence off the recent low, 6/16/11, this would be my take…

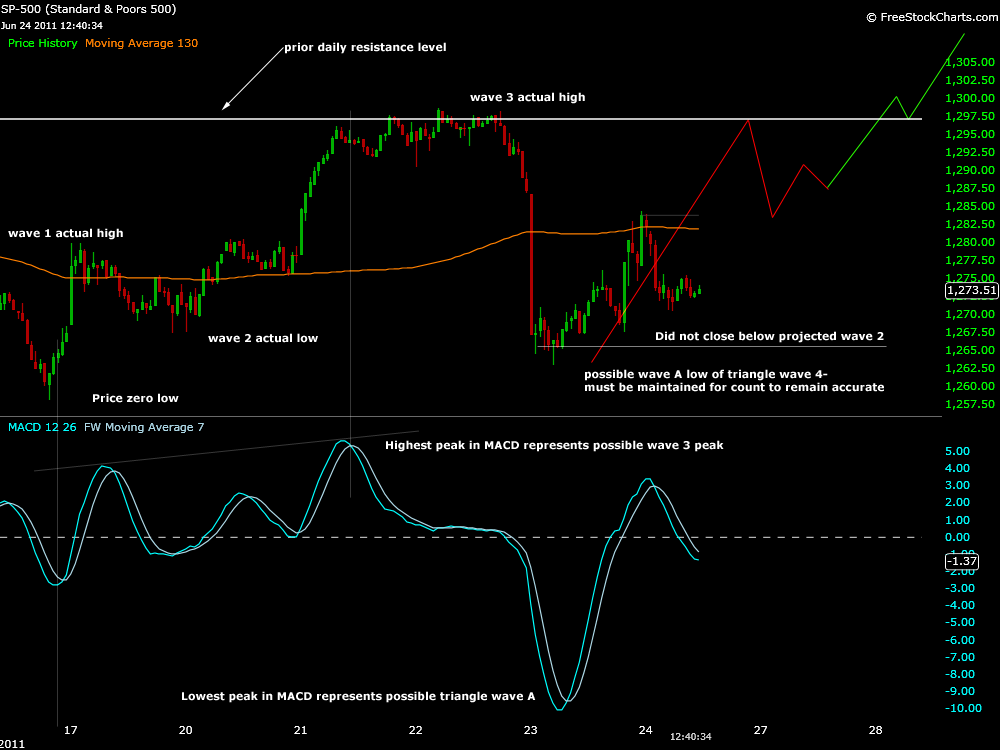
The MACD reading for the recent pullback resembles more of an A wave triangle wave 4 than a wave 2, and using the actual price points match price motion fairly accurately for a wave 3 projection.

Wave 2 is entirely possible but the beginning of that count can not be easily viewed.

The chart below shows the SPX at the 15min. time frame with notes on the possible count.

spx_062411_elliott_wave.png

This SPX correction was a bit more extended than projections but was relatively close to maintaining the projected price corrections of parent wave 2 looking at the price projections chart.

The chart below shows the price projections using actual price points of the price zero low on 6/16/11 and possible wave 1 high on 6/17/11.

spx_062411_price_projections.png

1266.3 was the projected low that needed to be maintained. Price actually never closed below this price although reached lower.

The closest closing price was actually very accurate in maintaining this wave count so far at 1266.32 according to stockcharts.com. Actual extreme lows of the correction were 1262.87.

This structure, and this low, will need to be maintained if this particular count is to be relevant.

So far after reaching what could be the A wave of a triangle wave 4, SPX has corrected higher possibly now in the B wave of the triangle.

This triangle will obviously continue to be perceived as indecision in the price of the markets but according to the wave count, a break higher is expected all things being equal in this analysis.

These projections could last the next few minutes, a day or a week before new calculations would have to be made.

Elliott waves exist until they don’t exist.

At this time I do not plan on keeping a running count of the Elliott Wave sequence in the SPX. I will monitor the pivotal wave 2 low and the wave 5 high of the given price projections.

Some More Notes on Elliott Waves:
Important to remember that every wave 5 is a wave 3 to a degree. The degree being time frame. This implies that every bullish wave is made up of 5 waves, even wave 3.

Divergence of the MACD only occurs between waves 3 and 5. However, at larger time frames this divergence will not be visible.

Hence the highest peak in MACD will represent the peak of a wave 3 of an Elliott Wave relative to time frame and wave count if a 5 wave sequence is present.

At the said time frame where the MACD peak is highest we will view this peak as a wave 3.

At smaller time frames we will see the divergence of internal waves 3 and 5 in the MACD of parent wave 3, and perhaps the completion of a wave 1 not easily viewed of an even larger time frame.

Wave 4 can correct up to the internal wave 2 low of the anticipated 5 wave sequence. This confirms the magnitude of wave 1 as relevant or irrelevant to the anticipated wave count.

Tagged on:
  • Friday 7/1/11 the SPX met the Elliott Wave target set on June 24th for 1336.70. Roughly a 70 pt run.

    The correlation to the MACD in this specific instance is quite compelling. It matches almost exactly with the expectations that were laid out in the post above.

    It’s too soon to say that these correlations will continue. It’s also much too presumptuous to believe that picking up an Elliott Wave at the 15min time frame is representative of a larger picture. And no prior analysis of the SPX at larger time frames has been considered.

    For studies sake, this has been a good litmus test for how to use the Elliott Wave as a tool in the analysis of price motion.

    The SPX chart below has been updated with the expected triangle wave 4 and wave 5 price action marked. Compare it to the above charts expectations and price projections.

    And still, a triangle breaking higher does not always denote the expected move- often a wave 5.

    Sure we reached the price targets and SPX continued to trade higher to wave 5, but what is more precise and telling than that is the MACD.

    The MACD is just as much a part of the Elliott Wave road map as the price. 

    In the new chart markup below, notice how MACD diverged between what is labeled wave 3 and the target wave 5. This is a great indicator that the expected move, so far, has not been corrective.

    A corrective move (against the intermediate trend which we could say had been down since the prior analysis) would have produced a violent spike in MACD at this peak in price. And we can see this was not the case at the 15min and even 30min kept divergence. 

    Slowing momentum in this case is a good thing for more constructive move higher. And although the move from the 28th to Fridays high appears to be the largest sharpest move, it is only equal to wave 1 through 3 in price (relative to where wave 4 ends) and less than equal in momentum.

    Having met the wave 5 target, expectations are that a parent wave 2 correction will form. This will be the ultimate indicator of a trend change. These 5 waves described in the chart now represent a wave 1 to a degree. Wave 2 can correct up to 100% of wave 1.

    I would expect a correction from these levels or near. The pitchfork drawn in the chart below also denotes that price is close to a top and perhaps exhausted at the upper parallel line.

    I did not hold or create a position in the SPX off this analysis. 

    To enlarge images after opening, click on the “Original” link in the bottom left.
    7/2/111