Helca Mining Co. Anticipating A Trade in HL

HL has been on the radar since I wrote my Elliott Wave count on it in this April 2011 post.

Ive been following HL recently and although I was expecting lower prices, the recent price action combined with a re read of prior analysis had me anticipating a trade off the recent lows.

What initially swayed my interest in pursuing this analysis was a comment towards the end of the prior analysis regarding a monthly time frame projection.

The monthly comments:
“The price of 11.56 on 1/3/11 correlates very closely to the internal wave 1 of 3 projected from the low of .50 cents in year 2000.”

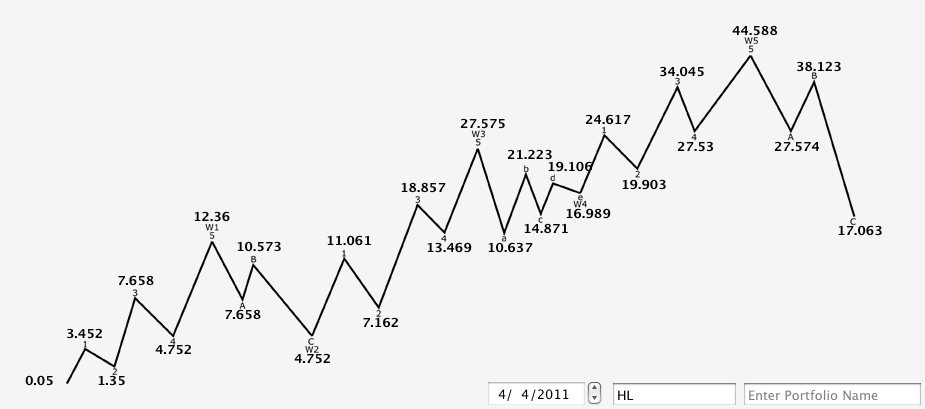
“That said, we are presently not sure if the internal wave 2 of parent wave 3 is completed at the monthly time frame, referenced in this monthly projection chart at estimated price of 7.16.”

That price motion projections chart seems to have foreshadowed exactly where we were headed in the wave 2 correction. HL’s recent low was 6.87.

This low will serve as point of reference for the trade setup. Similar to the prior setup for HL in this post.

While anticipating the prior low of 7.81 3/15/11 as the completed monthly correction did not pan out for the very long term trader, HL did produce fairly accurately a wave 3 target. The equivalent of what would turn out to be an ABC corrective wave higher.

Now that we have reached this new low within the same scenario, with confluence to a large time frames targets, constructive trading in HL recently could eventually confirm the larger move expected.

The trading in HL off the 6.87 low has so far followed an Elliott wave pattern.

The price projections show that HL has just completed a wave 3 off the low. As I am drawing up this analysis 6/22/11 and the market sells off.

This projection creates a band of buying targets between 7.38 and 7.18, per fibonacci retracement levels.

HL is passing through 7.38 right now and I am going to pick up a small starter position into the close. There is quite a big bid into the close of over 500K shares with a single lot at close to 400k. This lot did not fill but is supporting the selloff I believe towards the lower targets.

My order was filled at 7.40. So far the low of the day into the close was 7.39.

The above rundown basically solidifies what is expected from the Elliott Wave analysis. We have a target range of 7.38 to 7.18, have hit our first target and likely will reach lower given the mood of the market selloff.

A hold of 7.38 would represent a flat wave 4 correction. A move to lower levels would indicate a triangle correction forming if the Elliott Wave count remains intact.

The next part of the trade setup will be analyzed using Andrews Pitchfork, something I have just begun reading about over the past month with varied success in actual trades, however, have found it very useful for pinpointing intermediate time frame trading ranges, buy and sell triggers.

The Andrews Pitchfork has very precisely targeted this weeks ramp in prices, specifically the buy trigger point, but now also the selloff.

The chart below is a 30min time frame chart of HL and shows how the red sell channel pitchfork trigger line was broken on a gap, signaling a strong buy.

hl_062011_30min_upper_trigger.png

If we draw an ABC pitchfork pattern (green) from the prior low-high-low to project the beginning of a new uptrend from this buy signal, we see that HL held tight to the median line for two days and 7% run higher.

hl_062011_30min_median_line_lower_trigger.png

Intraday we can see that HL lost its lower parallel line on the 30min chart shown above. However, there was a precursor to this sell signal noted and is shown in the chart below. Note the way that price reacted to prior support, now resistance at the 7.53 level today.

The gray line in the chart below shows how the initial test of this level at 7.54 was successful but upon retest at the 5min time frame we can see that selling accelerated.

The chart below also shows the range of prices that I expect HL to trade for the best entry points in the shaded area.

hl_062011_30min_target_zones.png

This 7.54 level was outlined in a prior Stocktwits post with chart to the HL stream earlier last week.

hl_Jun.-16-at-10-21-AM_tweet.png

hl_061611_daily.png

Of course there is a battle of trading plans here, which is not good. The Elliott Wave scenario allows for a low of 6.94 to be hit and the trend remain intact.

The Andrews Pitchfork method low trigger line sell target is .15 – .20 cents higher.

My trading plan is to buy into the weakness that the break of the trigger line will create, towards the Elliott Wave structured support, as well as the gap fill.

—————-
The above trading analysis and executions where made on June 22, 2011 and as I continued to write up the analysis into the evening I thought it would be nice to keep a running note of the price action and my trading plan as the trade developed.

I was expecting lower prices and although anticipating the trade did prepare me for the price action, I would have to deal with much more.

The following is a brief glimpse into my trading day 6/23/11.

Awake, 3.5 hrs to open, usual routine, systems up, looks to be slightly lower open. Nice, might hit my buy target. Go for walk, breakfast and at the screens again.

100 sh at 7.21 crosses in the premarket for HL. I think about it a few seconds, go to enter an order for another small tier of the position and a few thousand shares buy it out and the ask is back up to 7.34.

O.k. I can wait. Things are developing.

8:55aam disconnected from the internet. I have no clue why. My laptop says I have internet connection but nothing is streaming, everything is dead.

I trouble shoot this for 15 minutes, nothing. Fairly aggravated, knowing that I don’t have internet and HL is entering my sweet spot, I pack up my laptop and head to the library nearby which opens at 9:00.

Its 9:30am now, I’m at the library, my laptop is still not connecting to the internet and I’m sitting at a library computer with Google Finance open, the HL chart reads 7.11.

My mood is being tested greatly. I’m sitting next to seniors getting their usual fill of sterile information and quietness, and I’m breathing curses-mentally at least.

I disregard how ironic it is that this is happening to me. Sticking to my trading plan I risk logging onto my brokerage account on the public computer to check my charts. Streaming charts will not load, nor will stockcharts.com streaming charts due to the fact you cant load java or silverlight applications on the public computer- I guess.

I check the bid, the ask, lot size looks healthily on the bid. Market doesn’t appear to be free fall and I wanted these lower prices.

I enter an order at 7.08 for another small tier to my position. Set the stop loss for the full size and go back to trouble shooting my computer.

I notice that HL drops lower to 7.05 as I refresh my browser for updates, I do nothing given the situation.

I monitor the stock and trouble shoot my computer. Finally I get a connection on my laptop. I load stockcharts.com, get my first view of live price action combined with my chart markups. I feel confident that I can pack up and head home to resume my day.

10:45am now, a few more system glitches but I was back up and running. I liked what I saw in HL, my charts and the market wasn’t bothering me. I entered another order for a larger tier more than doubling my size.

I’m long now at an average price of 7.20 and ready for some lunch.

This trade may or may not work out- same as any other. But what I’ve re-learned in the past 24hrs is that nothing, aside from pure flash crash mayhem, should sway you from your trading plan and that having that plan in place is essential to execution.

Buying is sometimes harder than selling in more ways than we can often expect.

Below is a fairly confusing chart of the Pitchfork analysis I have marked up at the 30min time frame to present moment I am writing this.

hl_062311_30min_target_zones.png

We can see that the shaded area was reached nicely and the blue trigger lines from the current green uptrend pitchfork were breached momentarily in the first half hour, but so far held reasonably.

Support was found at a warning line (white) drawn off the prior downtrend pitchfork. Price motion in HL is currently following an uptrend warning line drawn off the green pitchfork. Trading in HL has now held above the 5dma for almost an hour.

What also now appears to have formed is a triangle wave 4. The chart below shows the Elliott Wave count that is still intact with price above wave 2 lows.

The MACD is extended at what should be a triangle wave 4 A wave low. The sharpest extension lower in MACD, when expecting a triangle, should represent the lowest low in price to the triangle. Divergence to this low will be seen only at smaller time frames when viewing the MACD.

hl_062311_30min_elliott_wave.png

hl_062311_price_projections.png

All posts on HL or any ticker written about can be generated by using the meta tag links at the top of each post. HL.

Tagged on:
  • Quite a bit of after hours volume again in HL.

    Lots at 980K, 180K, 192K and 2.08M shares exchanged after hours at an average price of 7.29. Shown in the after hours 1min chart below.

    I did not buy into the weakness today, basically because its Friday and I did not want to increase my position into the weekend and lower my buying power on a Friday. 

    The correction was constructive in my opinion consistent with the analysis for a triangle correction as well as remaining in the pitchfork targeted trigger lines. 

    Price today found support at the trigger line and the second warning line of the initial uptrend pitchfork. Shown in the 30min chart below.

    This rough price also corresponds to the above Elliott Wave price projections for wave C of the triangle wave 4.

    I will anticipate, given the ominous sloppy day in the indices, a possible probe lower towards 7.15 on Monday and buy on that weakness if available.

    This price action would mimic the last sell off from wave 3 high, in that the lower median line was breached but held within prior support which has now become possible trend line support. Shown as the second white line below the trigger line in the chart below.

    So far price seems to be respecting the possibility of a turn higher for HL.

  • On friday I talked about the pullback being constructive and believed we might see 7.15 in a similar price breakdown that would be held by a developing trendline.

    Monday, 6/27/11, HL wasted little time reaching the targeted zone and touched 7.10 in the first half hour of trading. 

    An order to buy more shares was executed at 7.15 as planned.

    This low was created by breaching the trigger line, as expected, but held the trendline. 

    As well, a new 50% pitchfork was drawn to attempt to accommodate the sideways price motion and perhaps pick up better signals. 

    In fact this 50% pitchfork lower parallel line, outlined in the chart, held price in that first half hour after the sell off and through much of the first two hours of trading. 

    Price then reached for the warning line, maintaining the trendline, and rose with at that slope throughout the afternoon.

    This latest pivot is representative of what would be the D wave of the Elliott Wave triangle above.

    Expectations are for market indecisiveness to continue and price may become more volatile. 

    Trading in HL should reach the D wave target of 7.44, and the median line of the 50% pitchfork within the next two sessions.

  • Pingback: StockSignalTrader: Elliott Wave and MACD Technical Analysis For Traders » Possible Swing Point For GDXJ()

  • Today HL traded up almost 2.5% exceeding the target triangle price of 7.44 by a few pennies touching 7.47.

    This was the expected move and HL now rests above the median line of the pitchfork.

    At this point in the price motion it is expected that the range will become tighter. 

    Price should stay within the pitchfork lower parallel line, however as the Elliott Wave triangle comes to a point volatility will likely explode. 

    The prior analysis expectations are for this move to be higher.

    If HL does not immediately test the B wave high, look for prices to again test the lower parallel line at 7.29 where the next warning line intersects.

    If HL trades over 7.55, which is the actual B wave price, it should become clear that a new wave higher has begun. The wave 1 of wave 5 will be forming.

    If HL trades lower testing the trendlines, it will need to maintain its A wave low of 7.04 for the price projections to remain valid.

  • Yesterday was a big day for HL, and again expectations were met.The prior update below was anticipating a volatile break out of the triangle to the upside, a break over 7.55 towards the wave 1 of 5 target.HL did that right off the open reaching 7.59. Then sharply pulled back to 7.42 in the first hour of trading. This move in HL can be seen in the first two price bars after Wave E of the triangle on the 30 min chart below marked with the current Elliott Wave sequence. This move was likely wave 1 and 2 of wave 5 shown in the price projections above.After this HL traded to a high of 7.74, and today a high of 7.79. By looking at the MACD in this same chart, it is likely that these peaks are internal waves of wave 3 of 5. This would be the third wave internal to price target 7.89.Divergence to the MACD peak at 7.74 to the price high of 7.89 expected may be best seen at the 15 min time frame chart if this occurs.Some larger time frame charts are being included below. Monthly, weekly and daily time frames. HL is a a very interesting crossroads in price. The monthly is perhaps the most interesting. With its long trend line from 86′, it shows that HL could be climbing towards this line again. Also todays monthly close I view as positive as it was above the long term support resistance level of 7.53 previously mentioned in the chart above.Weekly shows the current resistance but also perhaps where price will be squeezed to next.Daily shows this resistance as well yet a diverging MACD that is perhaps about to cross zero.Certainly more pieces of the puzzle need to fall into place. However, supportive of this occurrence is the Elliott Wave sequence breaking out into a wave 5 as well as the analysis on the GDXJ for a sharp move higher out of a pivot zone in latest post “possible swing point for GDXJ”.We can be sure of the Elliott Wave scenario for two reasons. One, price itself has met expectations following price motion patterns. Two, divergence in the MACD from waves 3 to wave 5 is apparent. Wave 5 will carry less momentum than wave 3.If this current run in price was to create a huge spike in MACD, it would be more likely that this was a corrective move.Expectations are for HL to now hold its Wave 4 low and continue higher. Currently price is gravitating to the median line of the pitchfork.

    Prior resistance/support level of 7.87 is seen as the next level for possible correction. This correlates to the Elliott wave price target and would likely be reached in tomorrows trading at the warning line.

    Notice this high would bring HL over the daily downtrend line.
    6/30/11

  • Today HL gapped above the daily trend line that was highlighted in the prior comments update with charts below.

    This gap higher met target expectations that were for 7.87-7.89 and the highlighted area.

    So far price has held this target area which signifies that the break out was strong clearing the larger time frames resistance, but HL could still pullback towards its lower parallel and the daily downtrend line now broken.

    The expected levels to watch are 7.60-7.38. This range represents a number of different scenario yet I would act more aggressively if price reacted well to 7.47.

    This level holds the projected wave 2 internal of wave 5 level and would likely rest on a future warning line. But it breaks a prior support resistance level, breaks the lower parallel line and the 5dma. 

    A trio of negative events that could exhaust selling, scare out weak hands but do nothing to sway a trend higher.

    This price motion would likely result in an internal triangle wave 4.

    However, HL held up strong today. It may not need to correct before reaching the 8.20 target- at least so severely. Price projections chart above and simple math states 7.70 as a target.

    Time will tell.

    Pitchfork 30 min chart with warning lines and possible target zone outlined below. Also note divergence in MACD to wave 5 target remains.

    7/5/11

  • Today HL reached a low of 7.78 in the opening half hour. This level was within 8 cents of the price projections chart above for internal wave 4 of 5. 

    Strength was seen yesterday in holding above the prior resistance line and the shaded area at 7.87, so a shallow correction was a possibility.

    The lower expectations for correction, noted yesterday below, are also still possible but would have been more likely if HL did not make new highs today. 

    Today profits were taken at 7.93. In the first hour of trading HL seemed to be putting in another lower high with resistance at 7.95.

    The initial lot bought at 7.40 was sold for 7% gain. Remaining shares are held at 7.15 cost basis now.

    It was smart to take some profits, however they could have been better taken higher, or with a better stop placed under the opening hour of trading to allow for the run higher or protect if HL had continued to pull back.

    Todays 7.78 pivot created a pitchfork outlining todays move well and is shown in pink.Although the lower parallel (pink) and the warning line (green) were broken and now show resistance indicating weakness, the median line of the larger yellow pitchfork from larger time frames is nearby.

    A 15 min chart below shows this scenario.

    7/6/11

  • Today HL met the wave 5 target that was anticipated on June 23, 2011 in the post above.

    A sell stop was in place throughout the day for partial size at 8.19.  Partial profits were taken at 8.25 late in the day off the shares held at basis 7.15 for a 15% profit. 

    As the day progressed and constant selling at the 8.22-8.25 level seemed to never end I adjusted my yellow pitchfork. Prior it showed room to 8.30. 

    Upon adjustment it seemed that the selling was coming at the convergence of the warning line and the upper parallel of this yellow pitchfork adjusted slope. This rough price was also support dating back to 1/25/11 that had slowly been broken. So a lot of people probably wanted their money back.

    Besides that I was confident that I needed to take profits at the planned wave 5 price, here’s what I did with the pitchfork that made me comfortable a near term top was in.

    I looked at the bigger picture. I had been adjusting the internal forks at smaller time frames, mostly the 30 min. But now at wave 5, I went back to the daily.

    I adjusted the B and C points of the yellow pitchfork more exactly at the daily time frame. 

    It was obvious at this time frame that the warning line was causing resistance. I pitched the A point of the fork just slightly to mark a convergence with the high of the day and the warning line. 

    This daily chart is shown below adjusted. You can see that the median line of the fork now travels through the center of the range and does not start exactly at the low of 6/16/11.

    Then I zoomed back into the 30 min time frame with the now adjusted lines. This chart is shown below as well. At the very least, for today, this slope was precise in capturing the price action that led to the late day sell off.

    At this slope it can be seen that HL was crawling along the top of the upper parallel line (yellow) for much of the day. When this level crossed the warning breaking the upper parallel line the sell off ensued.

    The median line and 5dma are below at 7.89 which could create support again in the longer term support/resistance zone previously mentioned.

    However, the Elliott Wave parent wave 1 has completed itself according to the math and MACD has remained consistent with the wave count. A complete count of the wave is in a chart below. 

    A corrective wave 2 should be expected. Basic Fibonacci levels are used and shown in the projections chart above. 

    It is tough to fade this momentum and with a relatively good close this week, the weekly chart may create a MACD signal crossing creating more upside momentum.

    For now expectations are for HL to be constructive in its correction and that momentum will remain to the upside after this correction has completed.

    The 200dma is not out of reach at 8.70 and would be a next target if upside continues.

    If a parent wave 3 forms momentum will be very strong.

    About 1/3 position is left at 7.15 basis.

    7/7/11

  • HL was definitely in correction mode today 7/11/11. 

    Selling partial at the wave 5 target felt good today. I still view the correction as constructive despite the volatility. I look at volatility in this instance as efficient price discovery. What did the HL price motion find today?

    HL traded down to 7.48 low today, and if you followed only on freestockcharts.com you might have missed it altogether- A mini crash of 2.5% at 14:40 with large volume. 

    This level was not retested in todays trading, yet a level that was familiar to our expectations on 7/5/11 in the comments analysis below. A 1min chart of this dip is below.

    I did not have an open order at 7.47 today, but I will again look at how price reacts to this target which has now again been highlighted by todays trading. Besides this moment in the tape, HL held the lower parallel of the yellow pitchfork established last week.

    This pitchfork and subsequent warning lines are shown below at the 30 min time frame.

    If the correction continues, expectations are for HL to find support between 7.53 (a long term support/resistance level prior established) and the flash low of today.

    Keeping mind, from an Elliott Wave perspective, a correction of wave 1 can extend 100% if a bullish count is to remain accurate.

  • Today I added shares to my position in HL. 

    Price did not snap off the lower parallel line cleanly and found resistance at a flattening 5dma at the 30 min time frame.

    However, HL did regain the lower parallel as well as found further support at the warning line and the daily downtrend resistance line. Both are marked in the chart below.

    Being bullish on HL and seeing a constructive correction so far, I weighed the positives to trump the negatives.

    Right now price is supported at the wave 3 peak roughly. 

    It is still too soon to determine if the correction is over or if further selling will push HL to the 7.48 zone targeted yesterday.

  • Today HL closed up over 7% slicing through the median line and breaching the upper parallel line to hit a high of 8.49.

    This created a large spike in the MACD. There was little volatility within this move and price ended in a flag pattern.

    Volatility should not be confused with magnitude. There was great magnitude today, but little volatility until the flag began to form. 

    Think of volatility as detail. There is no detail in price motion when price moves from point A to point B in a straight line. The said price motion should be described as a large magnitude move.

    Anyhow, it is too early to pinpoint the Elliott Wave count given the lack of volatility in the move, yet we can clearly see that a break above wave 1 peak of 8.28 could confirm the beginning of a parent wave 3. The possibility of 7.58 representing parent wave 2 low is in effect. 

    As noted in prior comments below, wave 3 will be a powerful momentum move. The wave 3 target given the prior wave 1 magnitude would be 9.864. A price projections chart is provided below.

    More detail within the Elliott Wave will have to wait for further confirmations. 

    Right now we can see more clearly that the yellow Andrews pitchfork from the price zero low is still doing a good job of representing price ranges as well as trend.

    In the 30 min price chart below we can see the following:

    -Yesterdays successful test of the lower parallel line and the confirmation that the correction was constructive from this point as believed. 

    -A move higher through the median line, the 5dma and a  bull flag above the median line after a test of the upper parallel.

    -Price approaching the prior May 2011 top around 8.64, which coincides with the red trend line shown which is the monthly downtrend resistance line. The 200 dma is just above this at 8.75.

    A move to the 8.64-8.75 level could roughly represent an internal wave 3 of parent 3 price point. As always I will watch the price action closely with these expectations.

    Today partial shares of HL were sold into the close for 16% gain.

  • I sold some HL today that was purchased at 7.72 for an 8% gain. I still own 1/3 position size at 7.15.

    I am still not sure what the last spike in MACD on the HL price chart is representing. I am however presuming that the correction from this spike may not be over, and this is why I decided to sell partial shares today.

    A review of the latest price action sets up the basis of my view.

    Today’s trading low has bounced nicely off the 5 dma and has battled with the yellow pitchfork median line. The warning lines have done a nice job of signaling support and resistance through the sideways triangle forming pattern from the 8.49 high.

    Another 50% pitchfork shown in light blue calculated from the 7.58 low has revealed the possible failure to hold a median line support zone- using the 7.58 low as a guide for a possible new trend higher.

    The combination of these indicators leads me to be cautionary to immediate upside and the belief that a move lower may be likely for HL before the uptrend through monthly resistance can take place.

    This pitchfork and warning line analysis can be seen in the first chart below.

    Further, HL has been very close to tagging our previous upside target of 8.70 or thereabouts but hasn’t.

    HL has been trading sideways with volatile price swings and gaps, yet momentum has diverged little to higher prices and remained close to the zero line since the price spike and MACD spike of 8.49 on 7/13/11.

    This is swaying my previous opinion of this spike (noted in the below comments) from a possible internal wave 3 to perhaps a wave 1. 

    In the current HL chart we can see that a pronounced correction from 8.49 to 8.02 was made, but again that little momentum has been made to the upside and price appears very disorganized. 

    This lack of momentum is not characteristic of a parent wave 3 move, which would be very aggressive to the upside and the disorganized price motion off the 8.02 low is characteristic of a triangle.

    In either case, currently, the wave count is of less importance than the price motion expectations but I will bracket the following analysis of these scenario into two possible wave counts.

    First, the current consolidation as a wave 2 triangle correction. In this type of correction, price breaks out of a triangle B wave lower to a C wave turning point. This would mean that the spike in MACD could represent a wave 1 internal of parent wave 3.

    Reference second marked up chart below for Triangle Wave B scenario.

    If a pronounced pull back does take place, the extreme price point that I expect HL to reach would be towards the gap at 7.78 – 7.87 of 7/13/11. This price point would likely reach the trigger line of the larger yellow pitchfork. As well, 7.87 was a long term horizontal support and resistance line since Nov 2010.

    Sustained trading below this trigger line and below the 7.58 low would mark the prior Elliott Wave count as incomplete/invalid and a possible reversal of the uptrend being followed off the 6.87 low 6/16/11.

    Second, is the consolidation a triangle wave 4 internal to a degree of the parent wave 3? If so, then price will march higher out of the triangle. Reference the third chart below for this scenario. 

    This bullish breakout would likely confirm/follow through with previous expectations that parent wave 3 is underway and a range of 8.72-8.91 could be targets before a more substantial correction. The current lack of conviction is of a minor wave 4 internal to the powerful parent wave 3.

    If HL tests the 8.20 level successfully in subsequent trading days and breaks higher out of the triangle I may add to my position leaving my bias for a near term correction.

    Conversely if HL sells off and finds support at the lower trigger line of the yellow pitchfork I may add to my position expecting the correction to have exhausted itself lower and price to turn higher.

    My current sell stop will roughly be below the perceived parent wave 2.

    7/19/11

  • HL has been trading below its median line of the yellow pitchfork since the last update below. 

    Trading in HL found resistance at this median line breaking below it and finding resistance at it on 20th.

    A low of 8.08 was seen on the 20th and tested on the 21st. 

    Although trading seemed magnetized to the median line after selloffs, trading above the 5dma and this median line since it was lost on the 19th has only now occurred by gapping higher at opens. In each case a poor close was seen.

    Todays close was poor but with great volume. 1M shares into the closing 10 minutes of trading. 

    Trading reached above the prior peak of 8.49 and the monthly downtrend line but closed below the monthly downtrend line (red) and the median line (yellow).

    Given the fact that HL was only making progress through via gap opens, and the initial break through the triangle was lower, I did not add to my position in HL during the correction.

    I still hold HL at 7.15.  

    The price action in HL has been battling time frames. The monthly trend line remains bearish to price, but the underlying intermediate time frames price action supports bullish continuance.

    I will wait again to see how price reacts to the 8.20 level and the lower parallel of the yellow pitchfork.

    7/25/11

  • Today I got crushed on HL. I had bought shares at 7.88 on 8/1 and now have a basis of about 7.50. 

    I was in the money and let my basis turn negative. I had a bigger picture in mind and now that may not be playing out. 

    The markets are crushing the miners right now although GOLD reported earnings today and popped over 7% into a 3% down day on the indices.

    I don’t like holding through earnings but it does make me wonder. HL reports Tuesday 8/09/11

    I noticed the pre market price of 8.16 made and thought to sell if it cracked this price but didn’t. First mistake. Then realized 8.20 would be a ceiling that shorts would hit. I didn’t sell that either.

    Mistake after mistake made primarily because I had in my mind that 7.38 was a target, and on a day like today I might just that “bottom” and then launch higher.

    Calm as a cucumber I waited and got what I wanted, but no bounce. 

    This is whats bothersome about the market overall and HL is in a thick as thieves price war right now on the monthly. I hate triangles. The monthly chart below shows the squeeze.

    The only good signals: 

    The daily chart below of a 3 year trend line that seems to be supporting the thesis for higher prices. Unfortunately no thesis has made a difference in this tape.

    A weekly close below this trend line has not occurred and would likely have me beat tomorrow if so.

    There was some constructive price action in the 1min time frame after todays low, who knows if it will be meaningless in the am. 

    Though if constructive I may look to lighten up into 7.85 if we can get there.

  • This should be the last update for HL comments on this post/trade. Today my entire position was sold for a loss.

    I sold on Friday 8/5/11 as well, partial position from 7.88 for a loss and averaged down (into a loosing position!) to a basis of 7.25.

    From a 15% gainer, did I take an 8% loss today.

    “Calm as a cucumber I waited and got what I wanted, but no bounce.” 

    This post started off as one that taught me the importance of sticking to a trading plan, and has ended with complete lack of risk management and discipline being the theme.

    On Friday 8/5/11 there was potential for a double bottom, as well the Elliott wave 2 correction could have been in play, even today I believed the intraday bottom was holding as there was marginal support at a long term daily trend line.

    I held to give myself a shot to catch a bounce. And as stated prior, these bounces are just NOT coming in this market.

    They may come tomorrow or the next day, but I should not be IN a trade waiting for a bounce.

    Tomorrow 8/9/11 is earnings for HL and I just don’t want to roll the dice any longer. I can’t care if I’m wrong about selling and earnings are great and everything I thought would happen happens. 

    I have my capital back now and I don’t have to expect a perfect world tomorrow in a broken market. 

    I have been calm in this market sell off, perhaps unduly so and disregarding the damage of the charts.

    Two things that led to me cutting my losses today- the elliott wave pattern had failed to hold wave 2 low (no double bottom), a daily trend line was broken.

    There were many other signs that I should have heeded on much shorter time frames to protect my gains however, like the double top at 8.38 on the 30 min chart on 8/4/11 at the weekly resistance line. Chart below.

    I remember saying to myself, “double top at resistance” and did nothing to protect gains.

    Two more things created doubt for me today even with a large loss showing.

    One that made me want to hold…An 8 month falling wedge pattern that HL was now testing the lower range of in todays lows. 

    The other, that made me want to sell…The SIL silver miners ETF. 

    With all the patterns that could show up, this was the last one I wanted to see in SIL given the current market circumstances. Possible head and shoulders. Charts below.

    I tend to believe that I will be wrong in selling my position at this point but did what I should have done as my trade was no longer there…just not as efficiently as I should have.

    I must learn something from this trade, as I thought I had initially and in the past, if future trades are to be successful.

    8/8/11