Time has flown, and so has the market.
I have not been on the right side of the trade, but mostly flat on my short positions as of today. Scary intraday red candles have not been victories for the bears. In fact it has been prudent to ignore every pullback in the ES_F since mid December.
There has been no followthrough to the downside as anticipated. Much of the pivotal moments of continuation lower have been reversed in post market session futures trading resulting in damaging GAPS.
Refining my market timing as well as using a scaled in approach to this gappy market has really done little to dissipate frustration levels. The market has shown reason to do anything at anytime yet has not rewarded swing positions counter to sentiment right now (exceedingly bullish). Bearish swing and position trading have not been rewarded. The reversion trade has faded somewhat. Perhaps a trend higher is emerging.
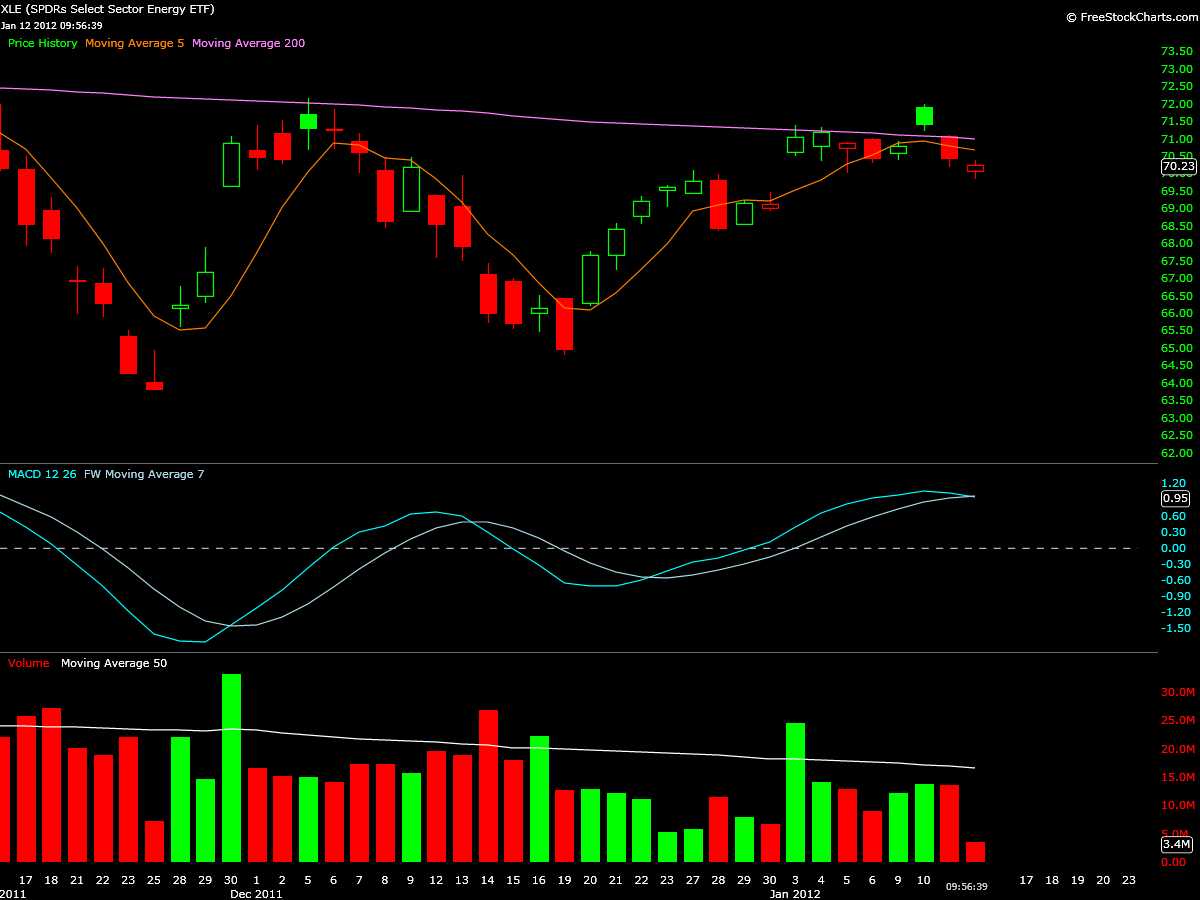
I still hold ERY. The XLE has found resistance at the 200sma and possibly formed an island reversal.
So far this position has been extremely frustrating from a time frame stand point but has not hit my limit. I am still trying to position trade in a market that isn’t quite ready to show its trend.
With markets “breaking out” towards the Oct Nov 11′ highs all correlations have seemed to dissipate under indices strength. EURSD, CL_F, TLT all have traded independently of the indices much more often than the past- or vise versa.
I am also short oil- again. This trade did not work out very well originally using DTO because I didn’t secure profits- again trying to swing into a position trade.
I still believe USO stays below 40 and CL_F could reach 86 this year.
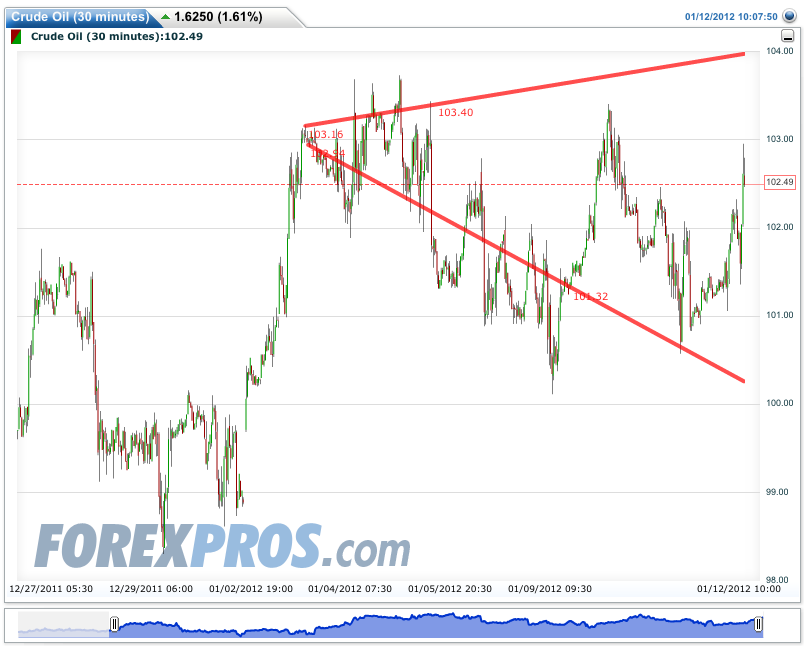
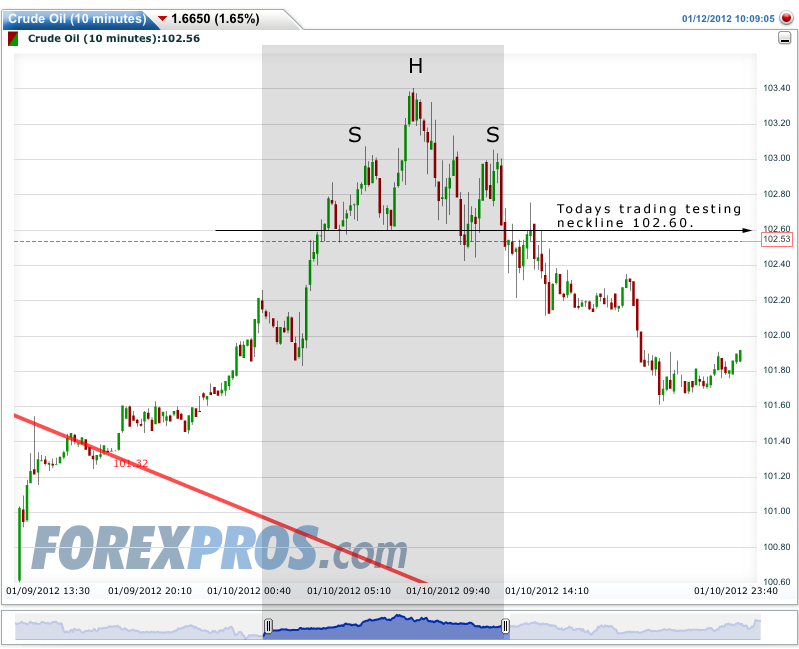
CL_F has formed a broadening top as well as a head and shoulders at a possible throwback.
This broadening top has been evolving since the beginning of Jan 12′ and has not been easy to trade.
This head and shoulders top comes in the middle of the possible larger broadening top formation at a throwback area. The neckline is at 102.60 and showing some resistance here in todays trading.
While this tape seems to show you every bearish formation in the book, it just blasts right through it higher. I don’t believe this is a sustainable occurrence ie; reversion will return on a swing basis. The trend could be higher, position trading may be bullish biased, but swings short should emerge if the trend is sustainable.
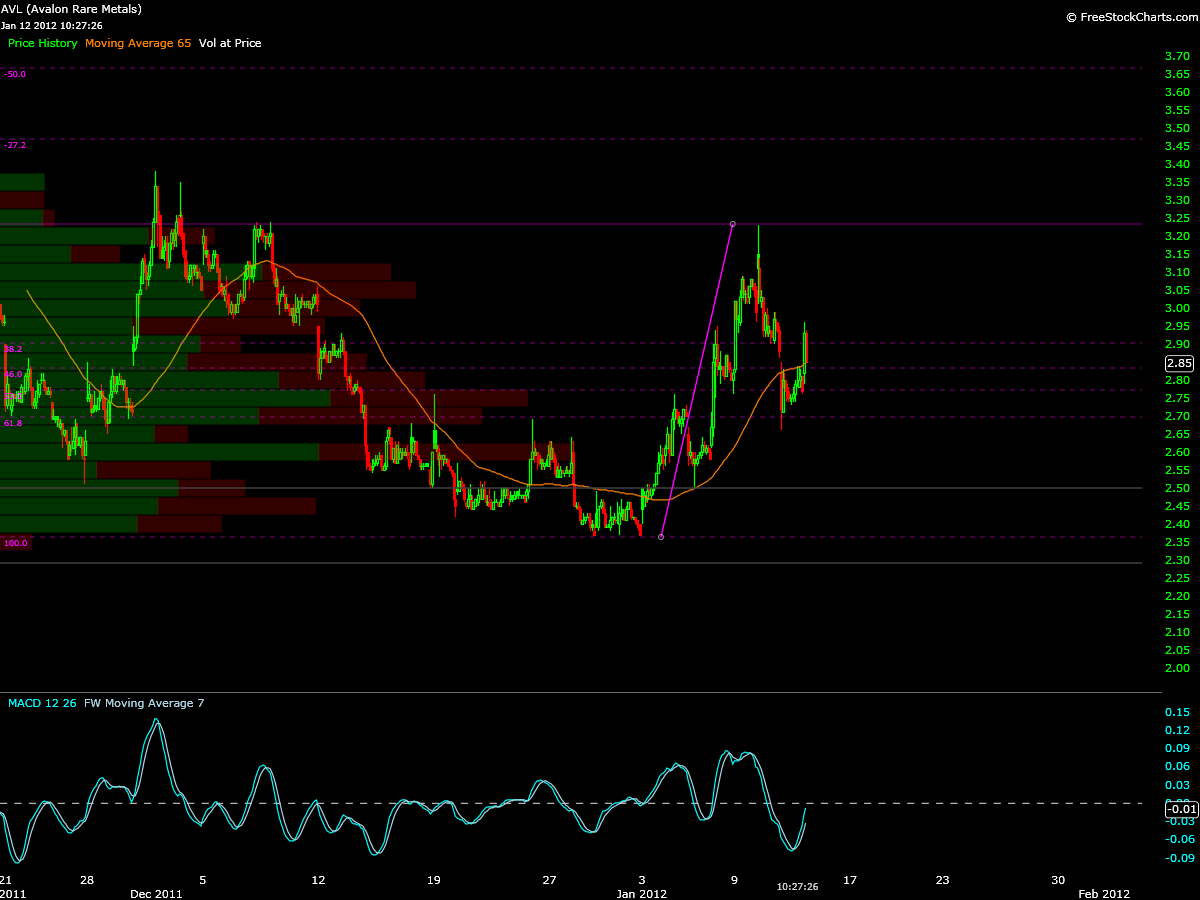
There are individual names that I have watched and one that I’ve traded long. I took a swing long AVL for a 17% gain. I am also watching the steel space AKS, STLD and casinos MPEL.
AVL has been following Fibonacci retracement levels very well since possibly putting in a double bottom on the daily time frame. I will look to trade this again.
This daily double bottom formation comes on great increase in volume, and so far a responsible pullback.
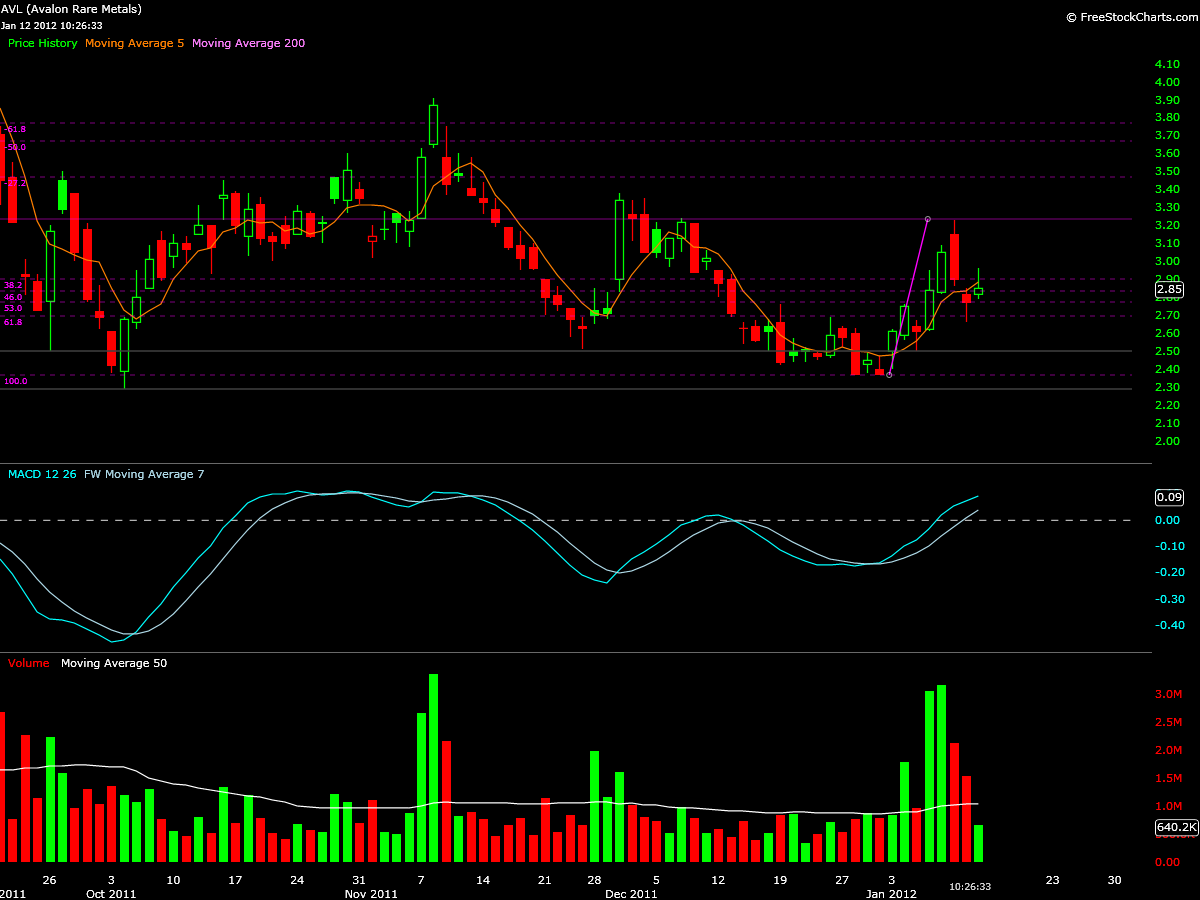
This 30 min chart below shows how Fibonacci retracements have outlined price motion well. Im looking for the current pullback to hold the .618 retracement and form a triangle. After the break of possible triangle any pullback can be bought with a stop below the .618 level. Target 3.50 – 4.00.
