CLF was a chart I had watched and heard a lot about for a long time. Every time I looked at the chart off June 2013 lows I thought, “Wow, thats how the chart should move.” I wanted in.
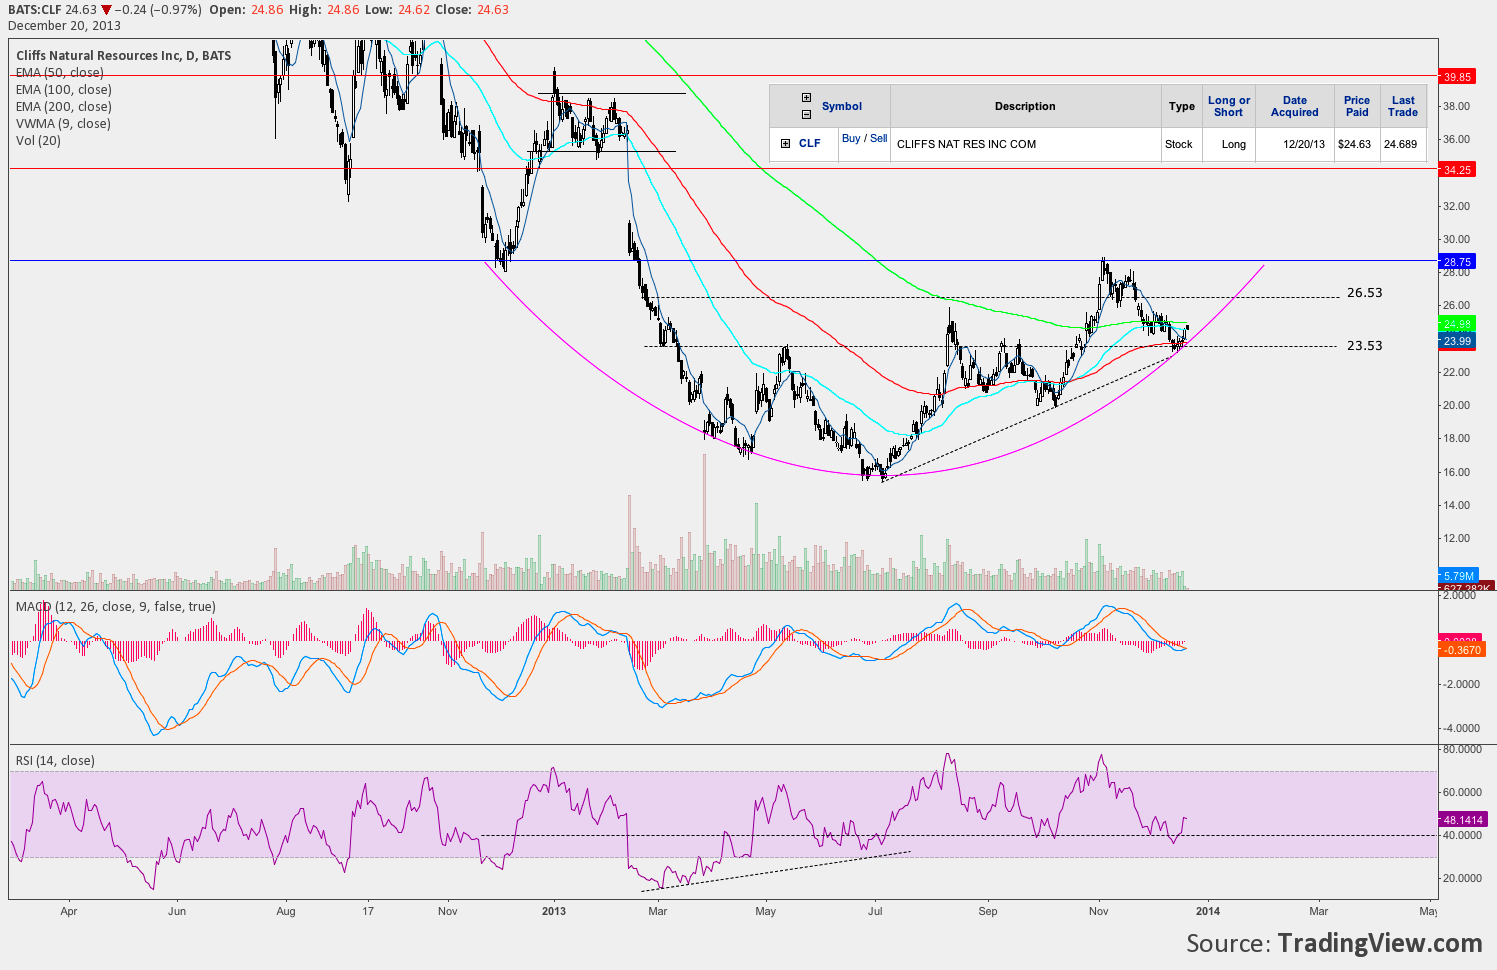
After charting a rounding bottom with potential for prior resistance becoming support I tuned into the 23.53 level, a rising daily TL and RSI 40 as support. Even with a little shake involved, I nailed the bottom and CLF ran to the 27s.
CLF has a nice chart with a big bottom “look”. I decided to hold with generous stop below the swing low. Didn’t work out and a -1.43 loss was taken on Jan 9. I think I could have post this loss hours before it happened- it got weak.
Here are a couple charts/thoughts.
I was patient with the trade entry and despite the nice action at my level I waited for a nice close above the 9VWMA. There was good volume, RSI had pulled out from below 40 and daily MACD looked ripe.
In hindsight, ultimately I might have been looking for a bigger setup than the correction I bought into allotted for. The chart price action previously seemed lock step higher but that price action had developed out of a 7 month base.
I was trying to pick a major turn off a 1 month correction for big gains. The prior swing low in October 2013 took 2 months to develop and the symmetry may prove to be useful here for a MM lower in time and price.
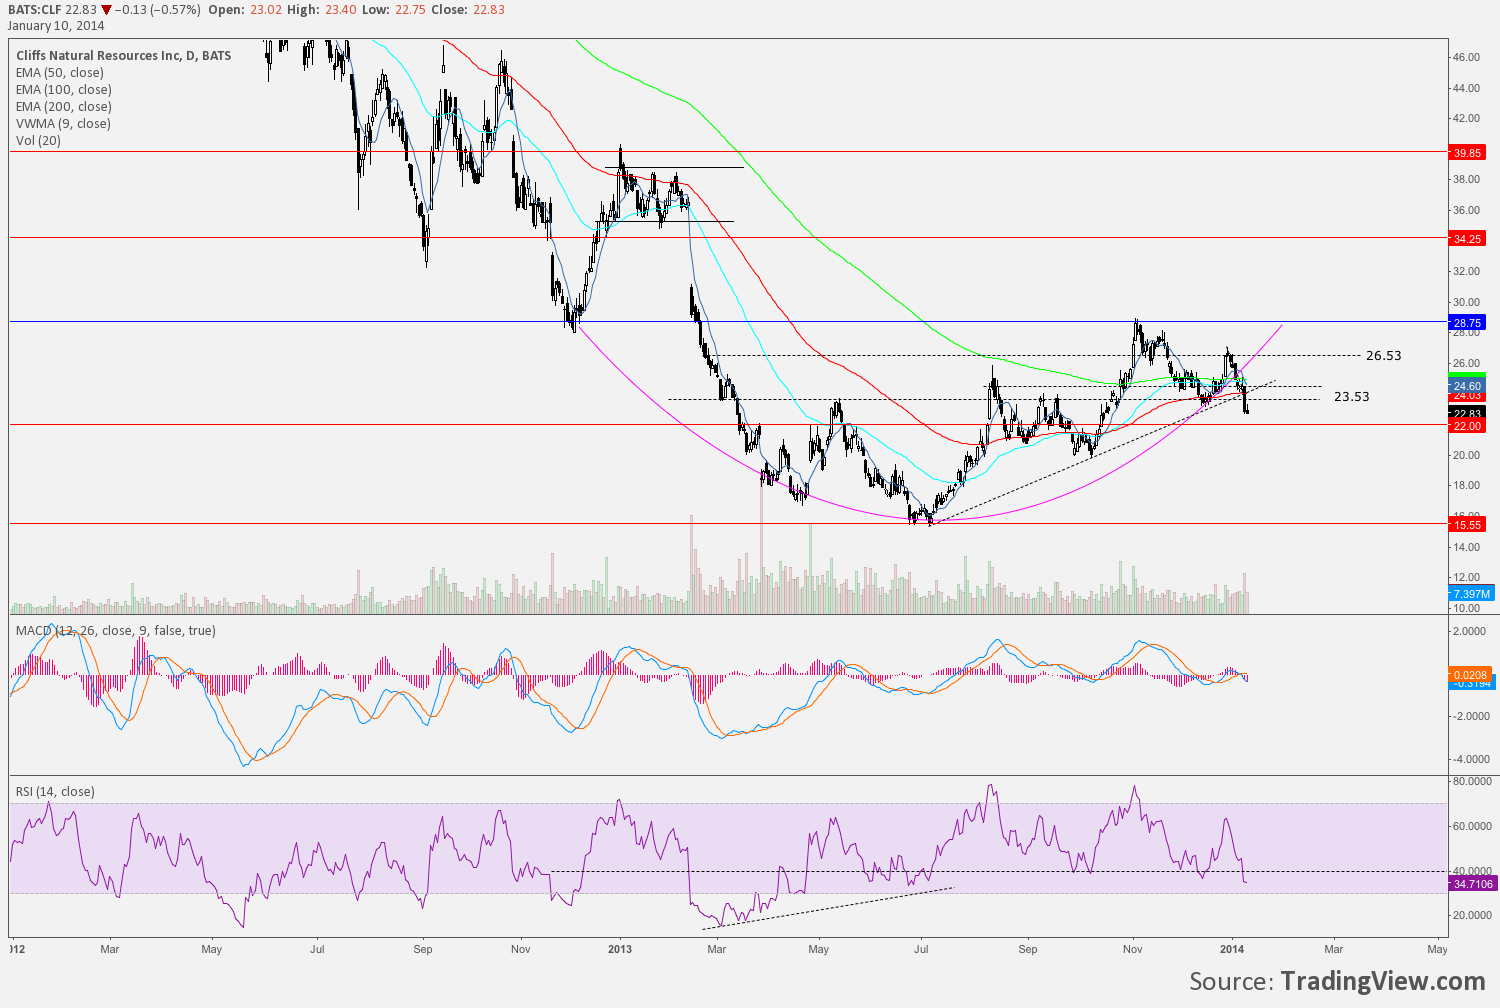
The current chart below- I think the stock could continue to 22.00 to 21.40 before a turn shows up. Intermediate support resistance levels, trend line and RSI did not hold expected support.


