I had an eye on BAS in May 2013 and began charting some levels. In this post I will run through the BAS chart on multiple time frames with added thoughts.
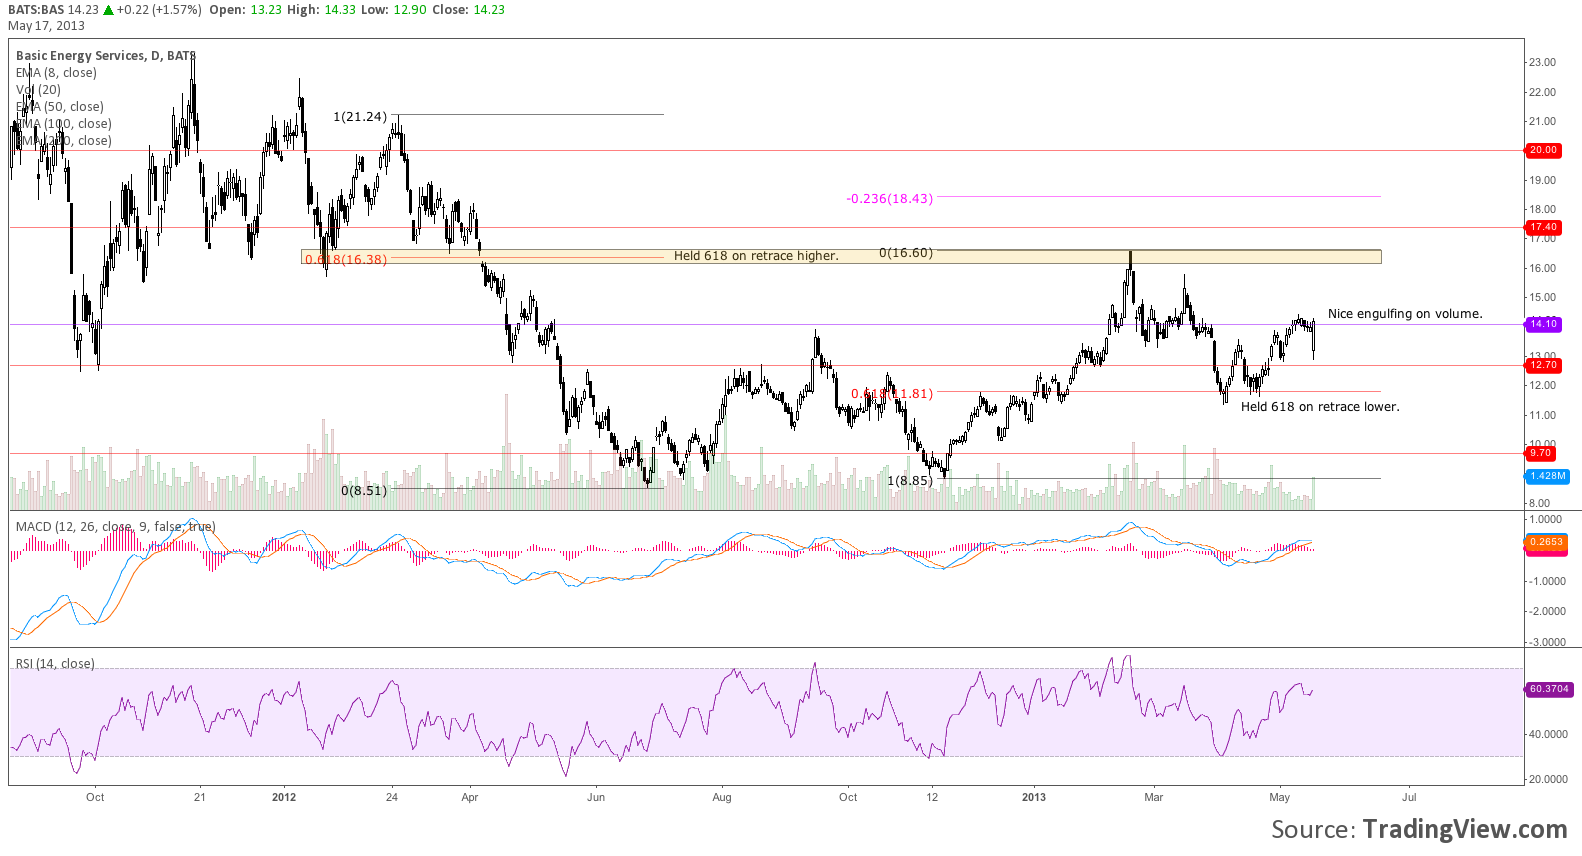
Original look at the daily time frame.
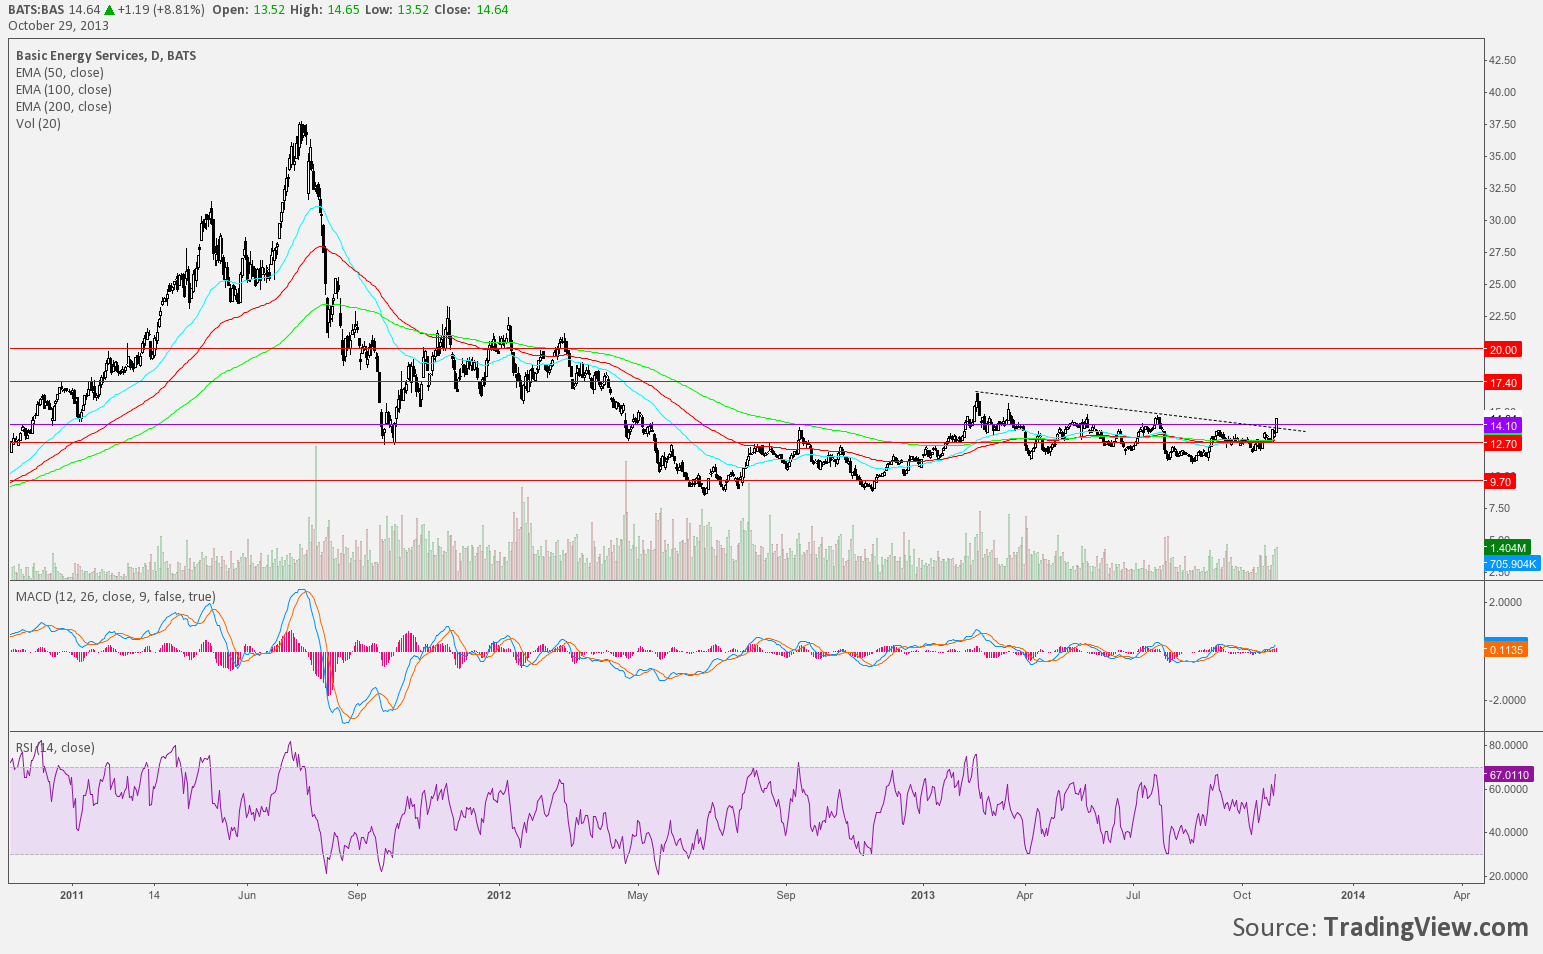
From that initial look BAS attempted to hold the 14 level two more times before a third attempt succeeded.
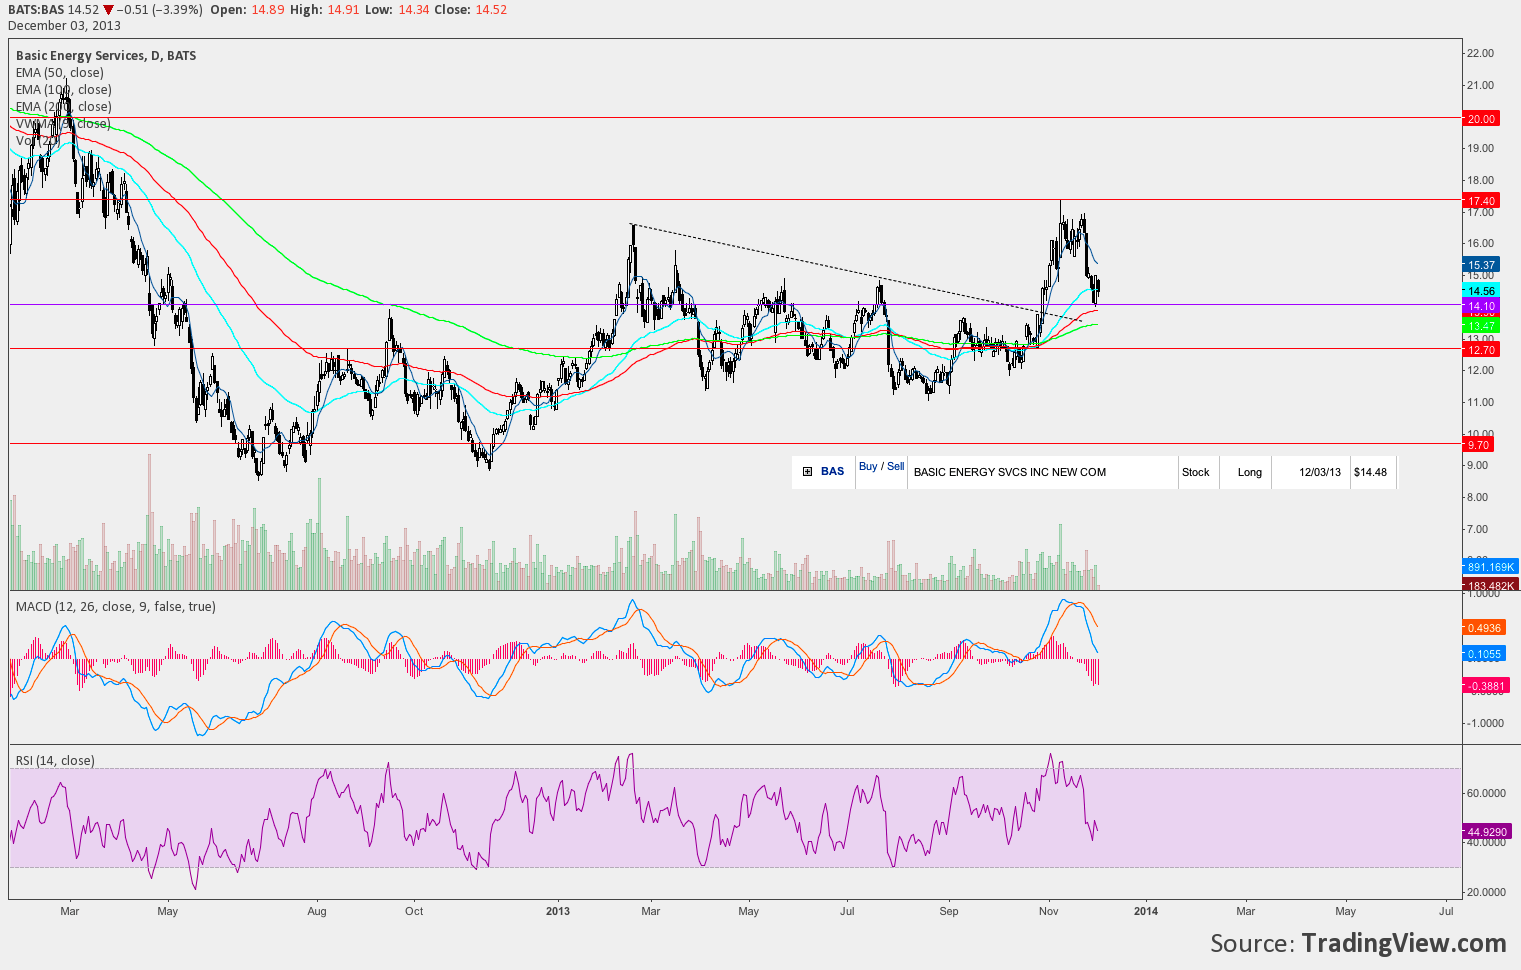
BAS made a run to the 17.40 support resistance level charted in May then pulled back. In December BAS tested the 14.10 level again and I took a position.
BAS has been quite volatile since entering breaking the initial pivot low before running to 16 but not triggering a stop. The remaining charts will be current from this Fridays 1/10/14 close- Monthly to 30 min time frame.
As well, even though I’ve noted/charted important levels above that should remain I stripped all levels and indicators from the charts below before review to see what else I could find.
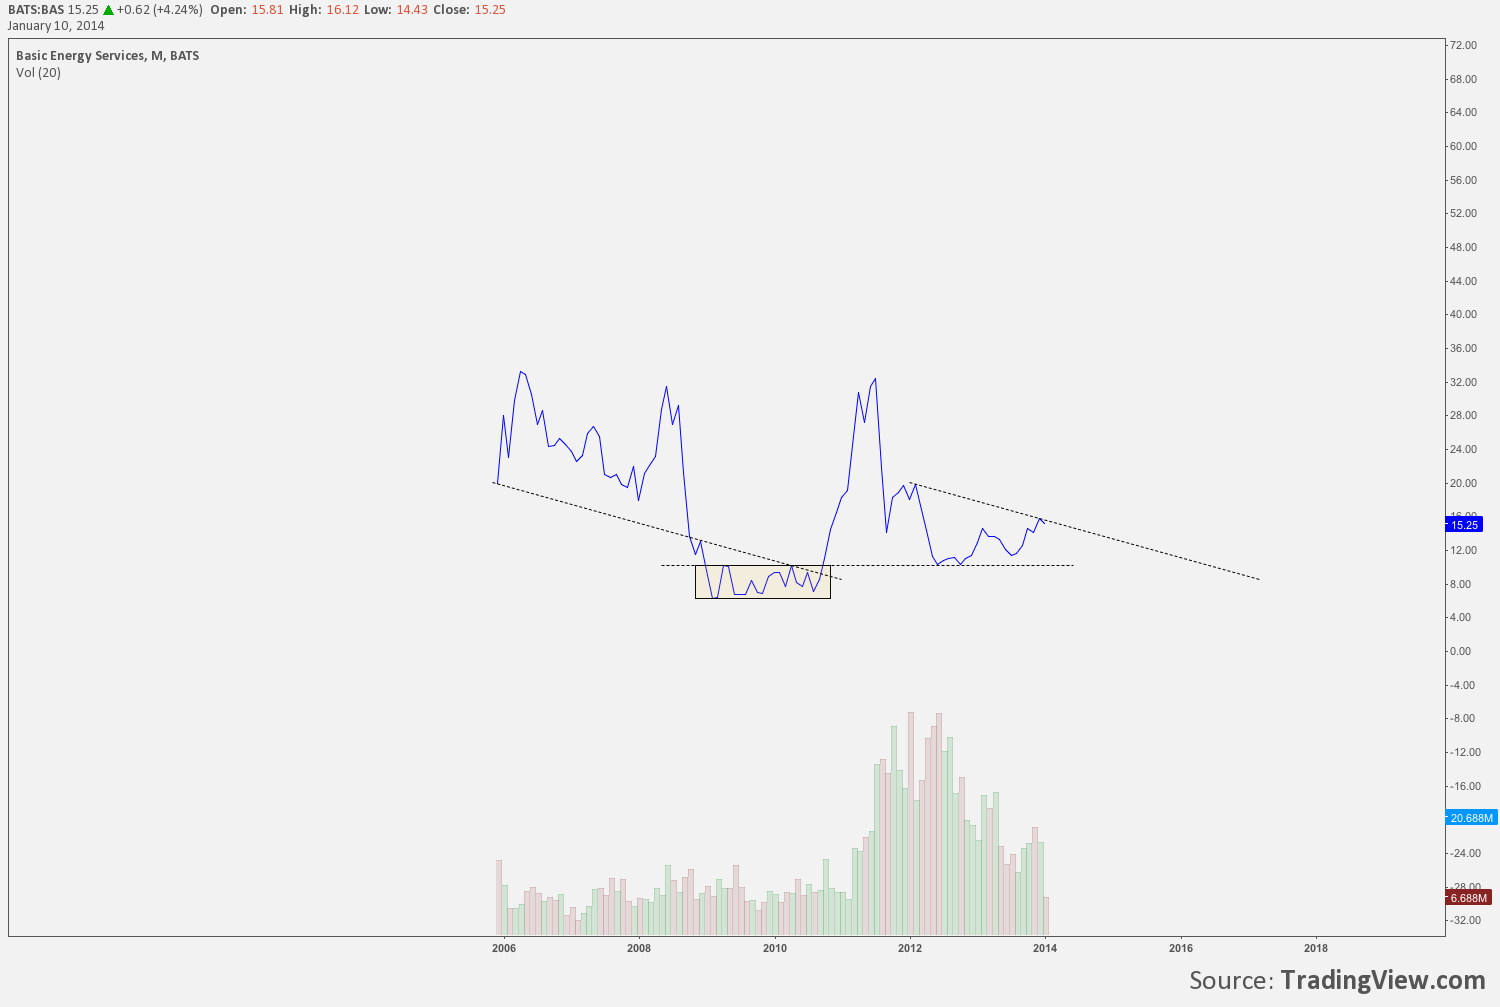
The monthly chart below shows an interesting slope that may be repeating its importance at the recent resistance highs.
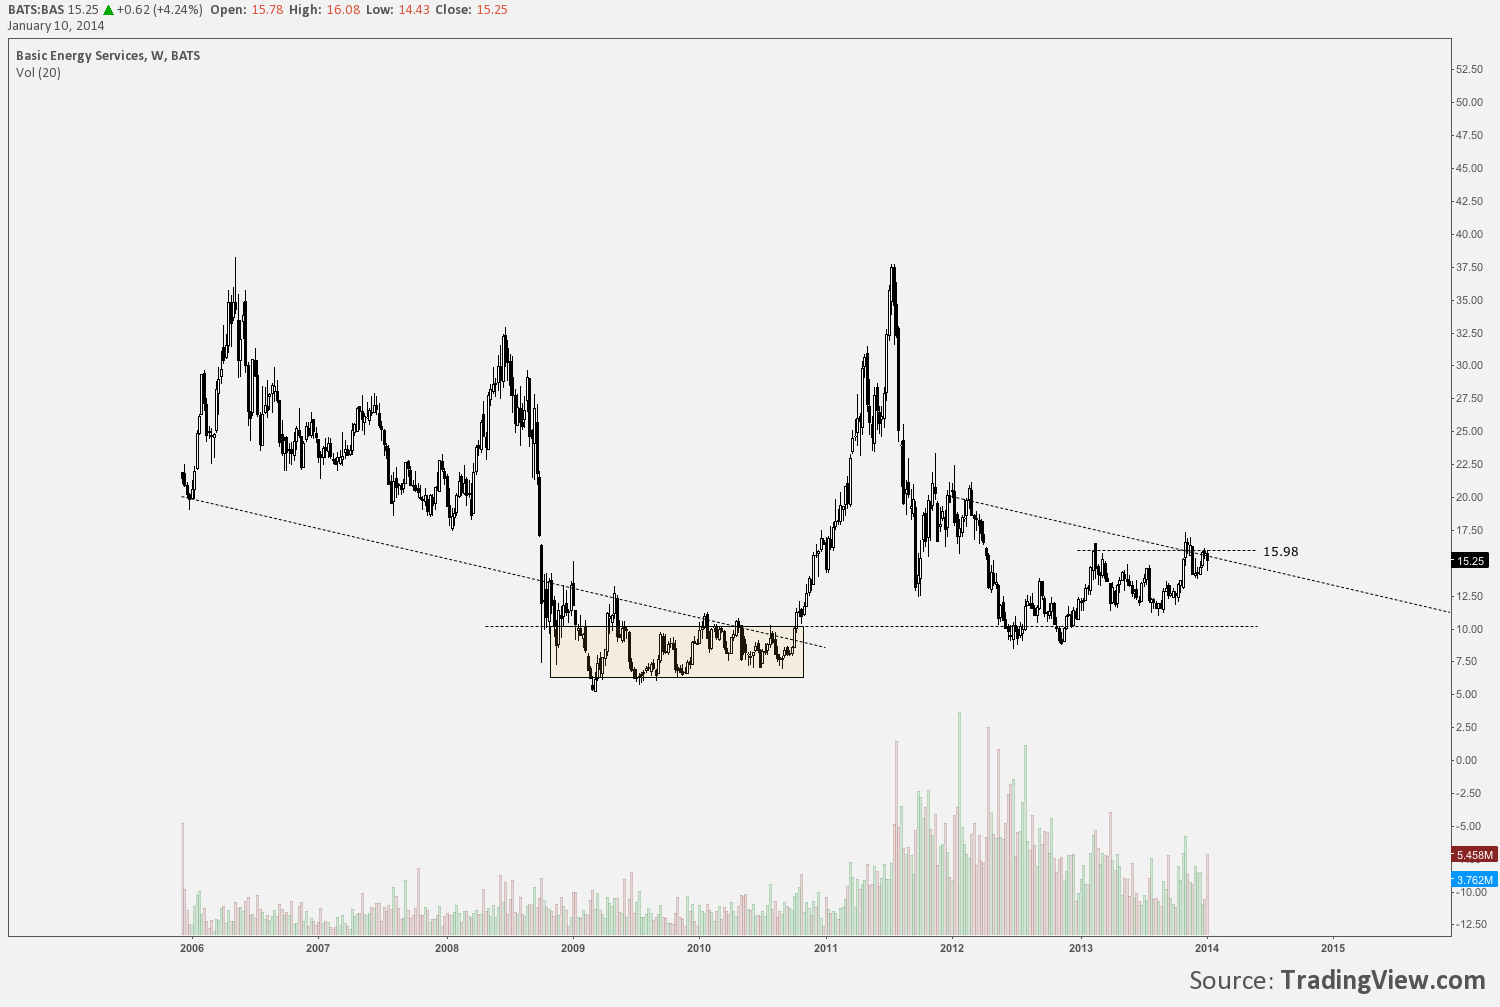
The weekly chart highlights 15.98 as possible important resistance at the monthly sloping TL.
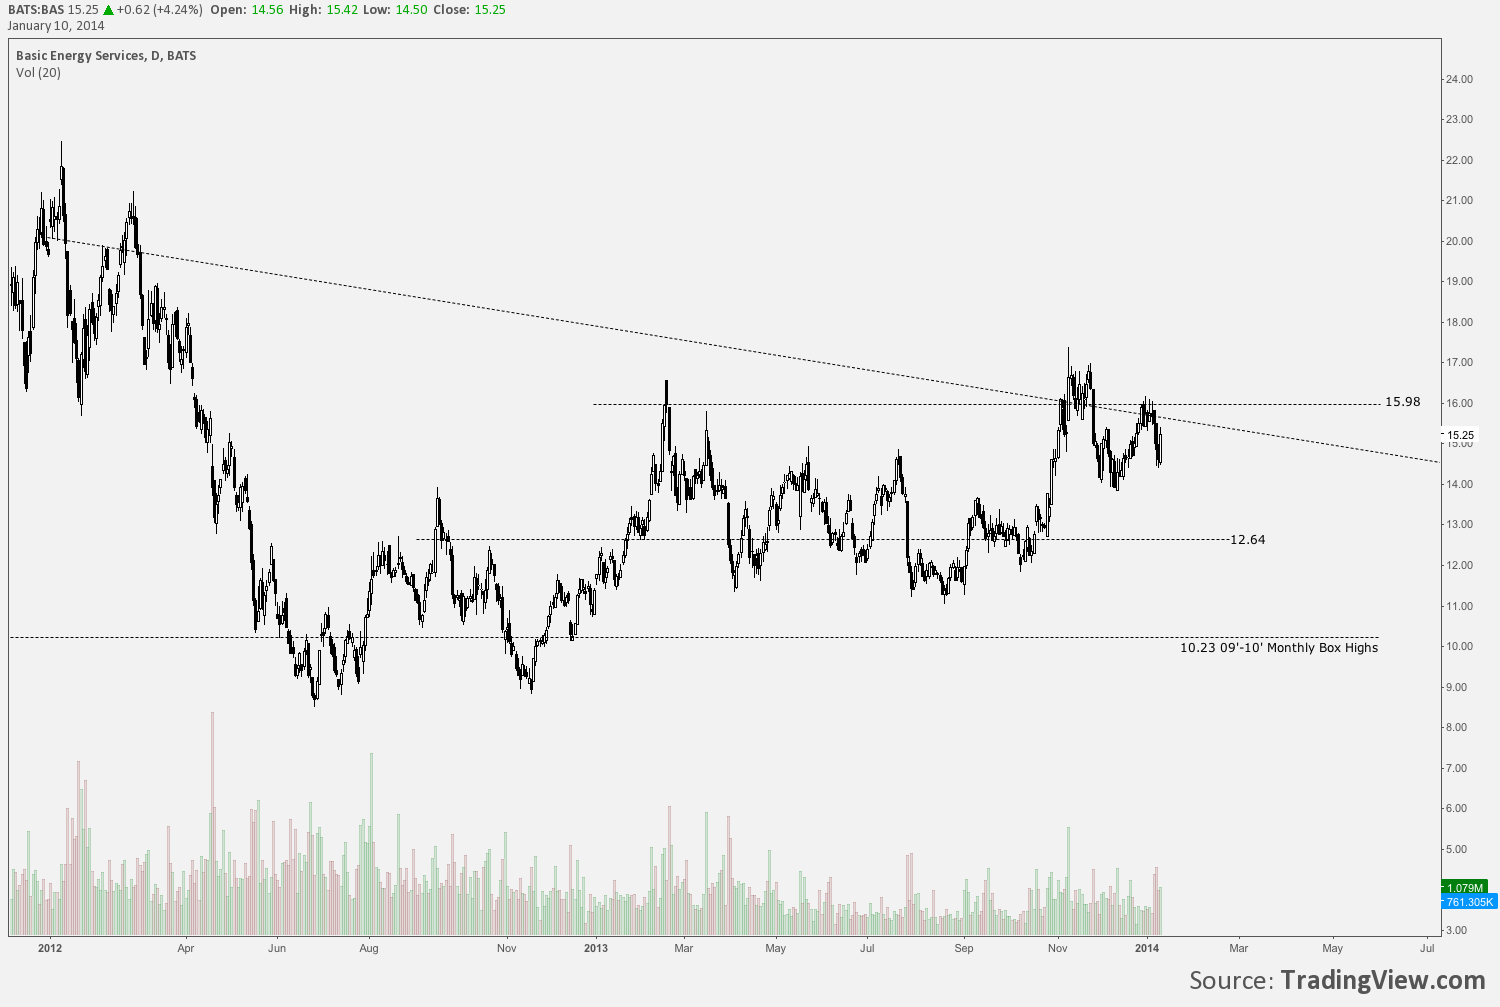
The daily chart indicates support at 12.64 then the monthly 10.23 level.
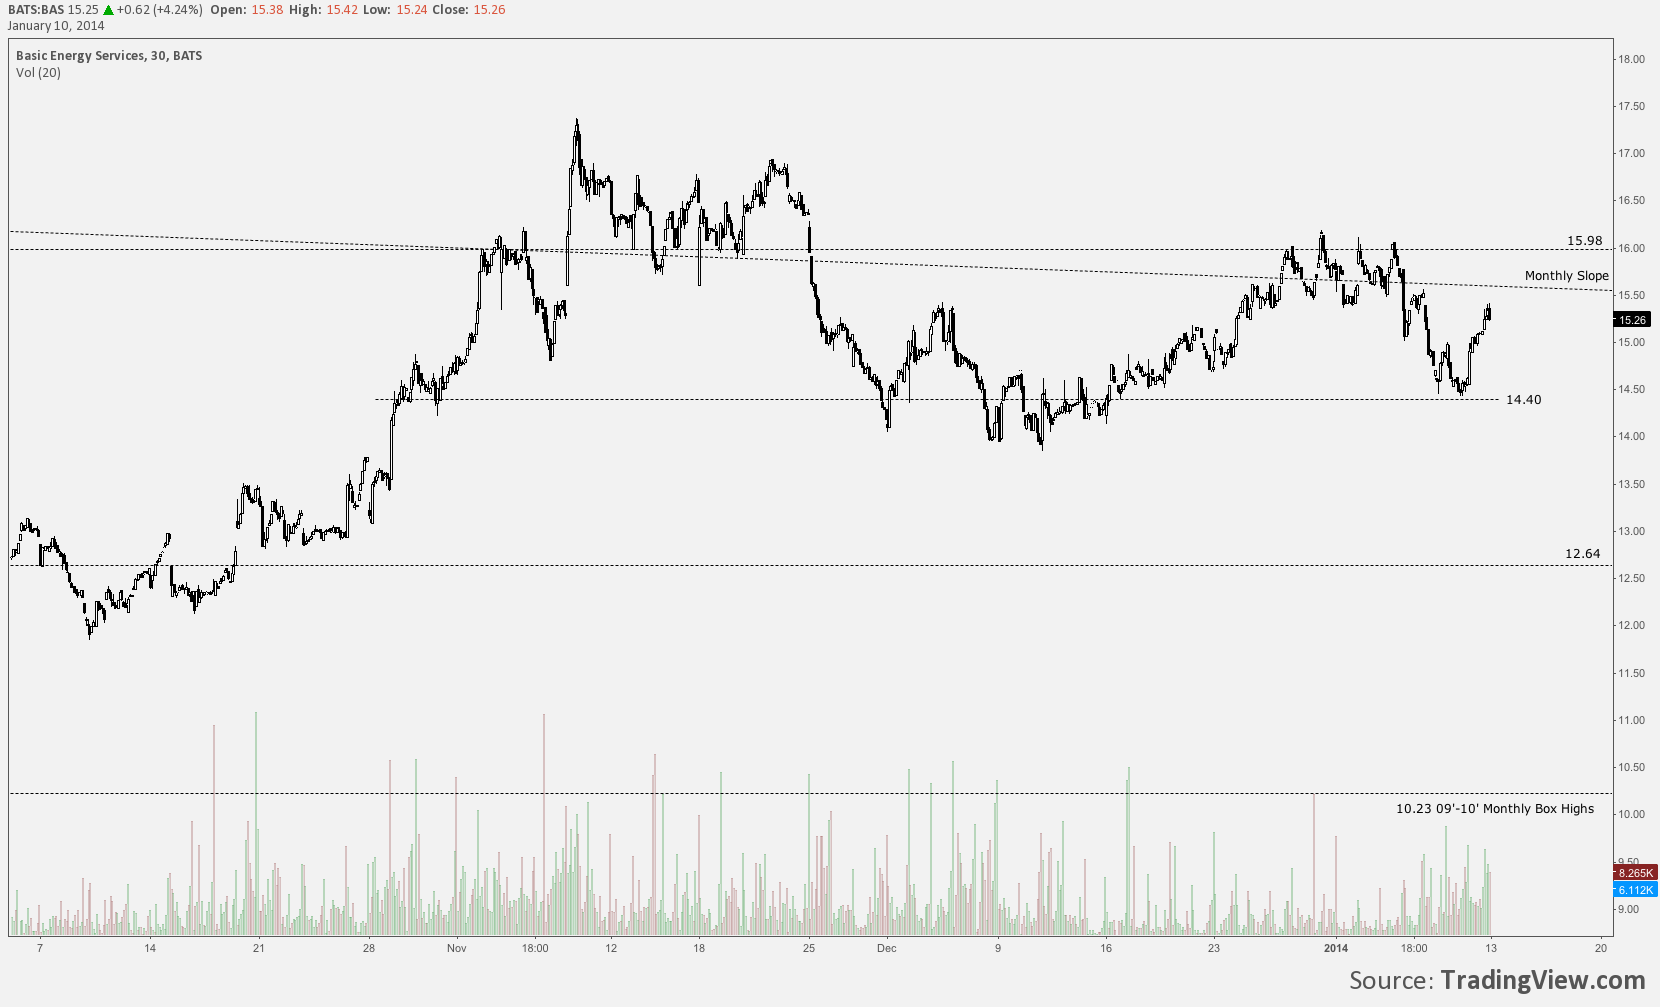
The 30 minute chart highlights 14.40 as intermediate support resistance.

