
Tellabs has been flagged in the past for a possible 10% gain, price target 7.50. This price level is near the 200 day moving average looking at a daily chart.
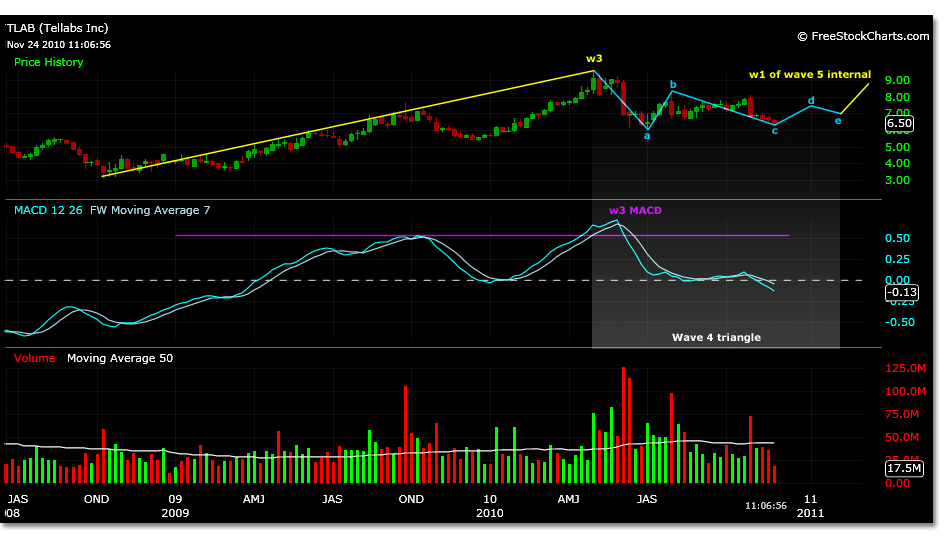
In late November 2010, the price motion of TLAB was speculated to be in a long term triangle wave 4 formation. Looking at this chart or reading the previous post to review, it appears that TLAB may be breaking out of a flat correction within the D wave of the larger triangle trend today.
It is not certain that an Elliott Wave pattern will form within a triangle, although it is possible to see a 5 wave pattern in the B wave of a triangle. The trading price targets for TLAB are based from triangle formation calculations, but there is some correlation to a three wave pattern developing in this D wave towards the 7.50 price target and this is why the flat correction is being sighted.
If a wave 1 magnitude is calculated from 6.28 to 6.84, shown in the chart below, a wave 3 of this pattern projects to a price of 7.53 which is near our target price for wave D of the triangle formation. A flat correction wave 2 could be used as a guide for the price motion of TLAB since the 6.84 top on 12/13/10.
An exit of this trading formation begins with a move off the tested flat correction price (projected 6.62) to a internal wave 1 of 3 projected price of 6.78. This is basically the price high of today at 6.76.
If the strong trading action of today can be used as inference to the beginning of the expected move higher, any correction from this point (from the low of the day or a 6.60 projected corrective wave 2 price target) could be bought.
If this flat correction support scenario is to unfold, TLAB will trade higher towards 7.50 from here. If the flat correction does not hold, 6.50 could be next support- a 62% retracement level. With the ominous gap below at 6.38, caution should be used in entering a trade at these higher levels if this near term flat correction support fails.
