Hecla Mining Co was trading strong with the markets and metals today.
A break down of the trade in HL, so far, exposes the Elliott Wave that was used to bring in a 6% gain but also why some was left on the table.
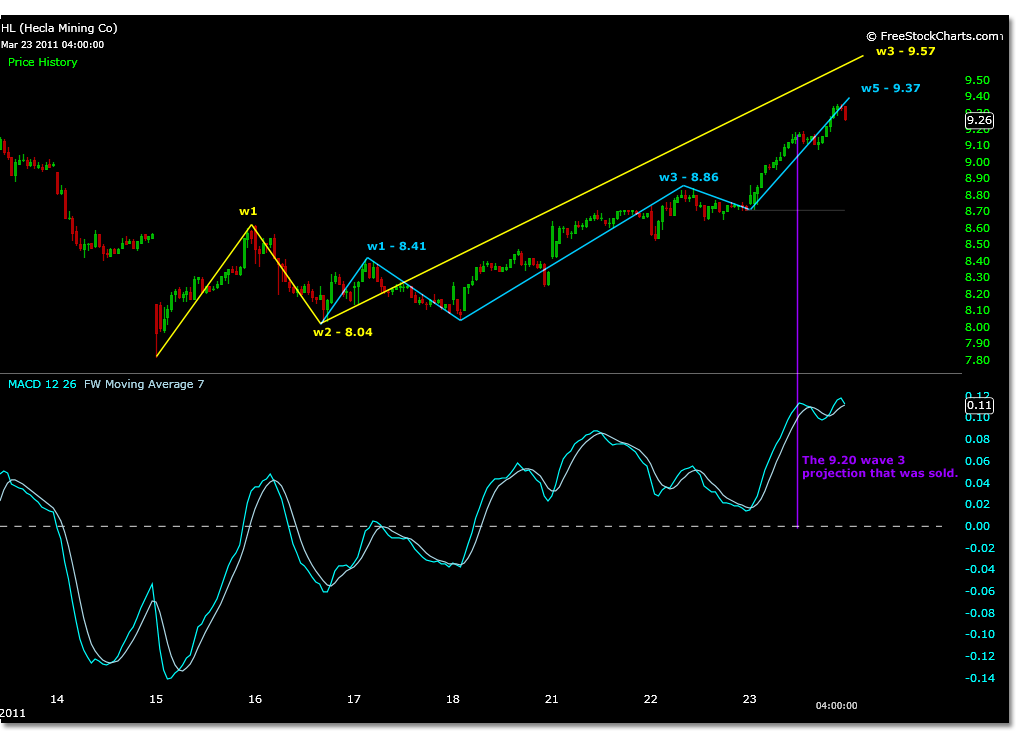
From the price zero point at 7.81 to the parent wave 1 high at 8.60, this magnitude calculates to a wave 3 target of 9.57. These parent waves are shown in yellow in the chart below.
After a parent wave 2 has formed, a similar five wave count can be projected using this wave 2 low. Because this is now an actual low, and not projected, it can at times be more accurate to the current price action.
Using this actual price, in conjunction with the actual internal wave 1 high of parent wave 3, will give you a range for the parent wave 3 price projection.
This additional step of using actual wave price projection was skipped unfortunately showing some lack of discipline to the trade setup.
What was done instead, was a projection using the absolute low of wave 2 at 8.04 and the prior projected high of parent wave 3 at 9.57.
If you projected 5 waves within these two price points, 8.46, 8.98, and 9.57 are your wave 1, 3 and 5, price targets shown in the chart below.
9.20 is the internal wave 3 of parent wave 5 price target using this method.
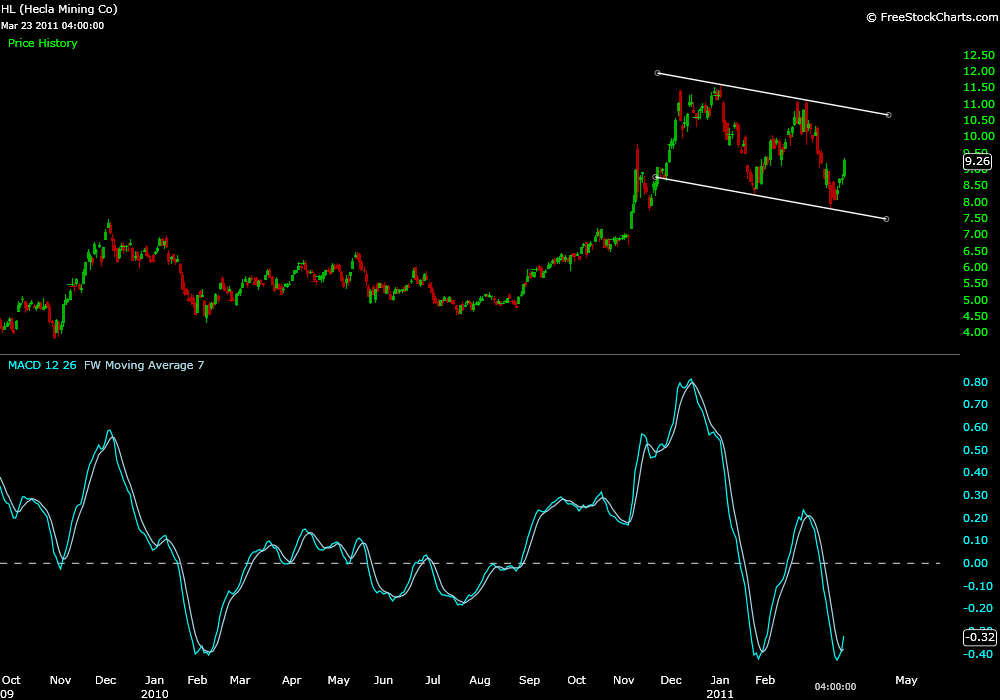
This price was accurate for the pause in trading at which point a short selloff began and triggered a sell stop based on this price and the macd peak shown in the first chart above in purple.
No money was lost, but what was lost was as important- a greater resolution to what was occurring.
A look back at the actual internal wave 1 of parent wave 3 calculation that was not done, shows high accuracy to todays price motion from an upside targets standpoint.
This additional wave calculation represents the projected 5 waves of the parent wave 3 as calculated by the internal magnitude of wave 1 of 3 (actual 8.04 low and the actual 8.41 high shown in blue waves in the first chart above).
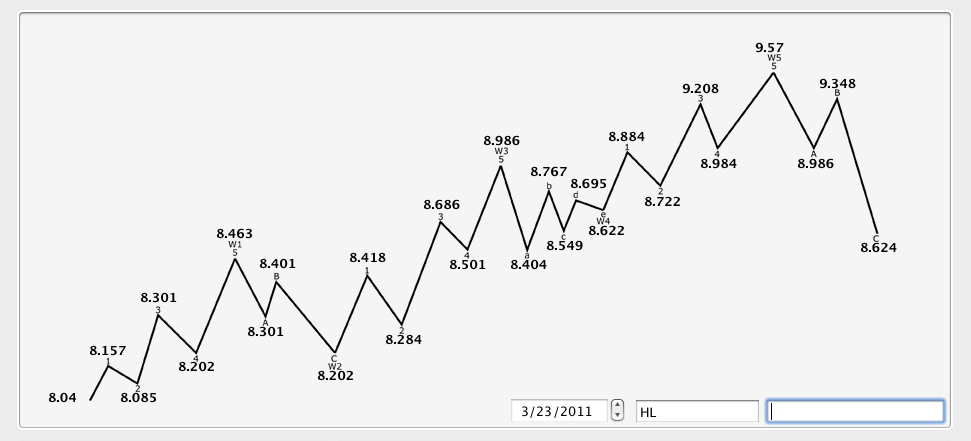
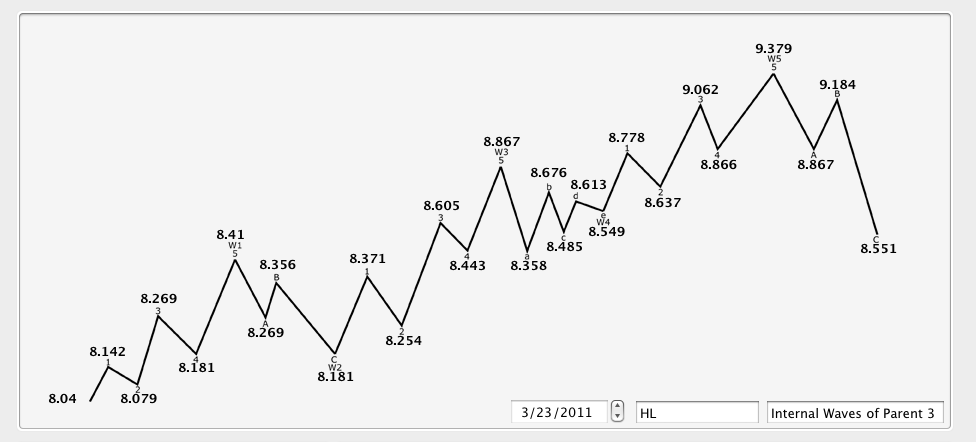
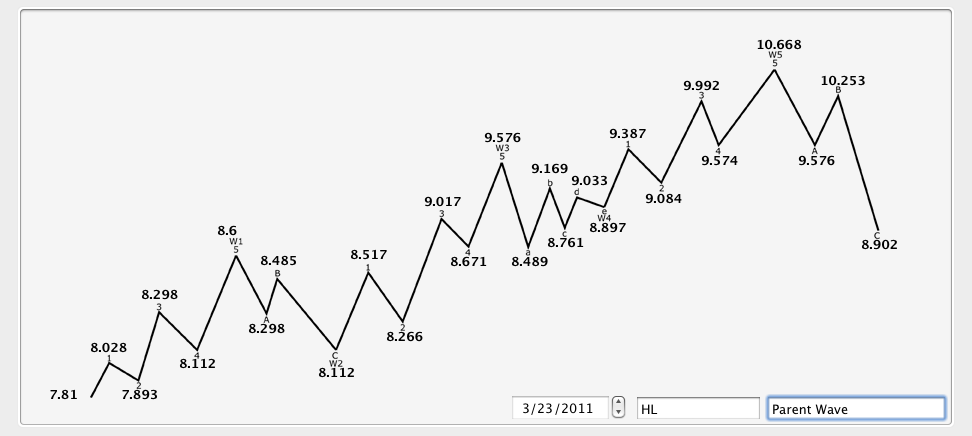
Using this internal wave magnitude 8.86 is wave 3, which was yesterdays resistance high, and 9.37 is wave 5 from the price zero low that is parent wave 2. This is shown in the calculations chart below.
9.37 ended up being 2 cents off the actual high today.
In this example, accuracy is what is being sought after, but in either case it is a matter of time frame that ultimately makes the difference if an Elliott Wave is to form and provide any assistance to the trader.
The magnitude of wave 1 is the most important wave calculation that can be made as it is carried throughout the 5 wave sequence.
Although a parents wave 5 projection can be expected, the most present time frames calculations to this same projected price, can be much more accurate intermittently.
The strength of HL has been certain to this point. 9.57 is still the parent wave 3 price and although the lack of volatility to this stage encourages holding for lack of lower buying opportunities, its all a matter of time frame.
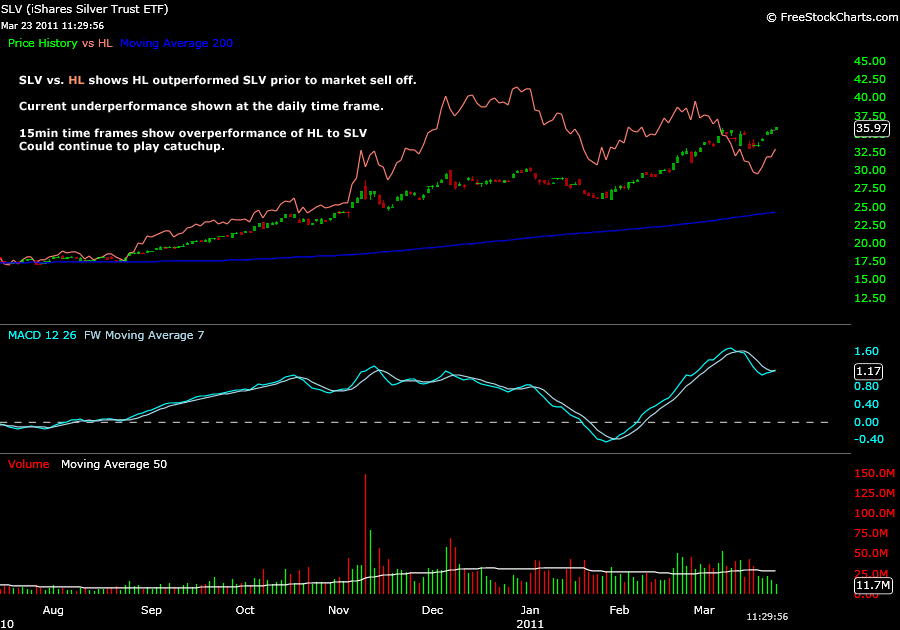
In addition, a quick look at how HL has performed against the SLV shows that it has outperformed in the past. Currently underperforming, it may have some catch up to do if this trend continues which could also lead to the higher price projections. This chart was posted from the StockTwits today.
In conclusion, if a parent wave 5 is to develop, it could reach the top of the daily resistance line around 10.50, shown in the chart below. Do not forget a parent wave 4 correction, if it decides to show and if Elliott Wave calculations continue to be accurate.
The last chart below shows the calculations made for the parent wave. These calculations are not relative to time or volatility.

Pingback: StockSignalTrader: Elliott Wave and MACD Technical Analysis For Traders » Helca Mining Co. Anticipating A Trade in HL()